
Index Research
Intraday Analysis for 11 Aug 2026
KRVFinMart10 August 202666 min
Educational/Derived AnalysisSource: KRVFinMart Research Desk (End-of-Day)As of 10 Aug 2026, 03:38 PM IST
Intraday Analysis for 11 Aug 2026
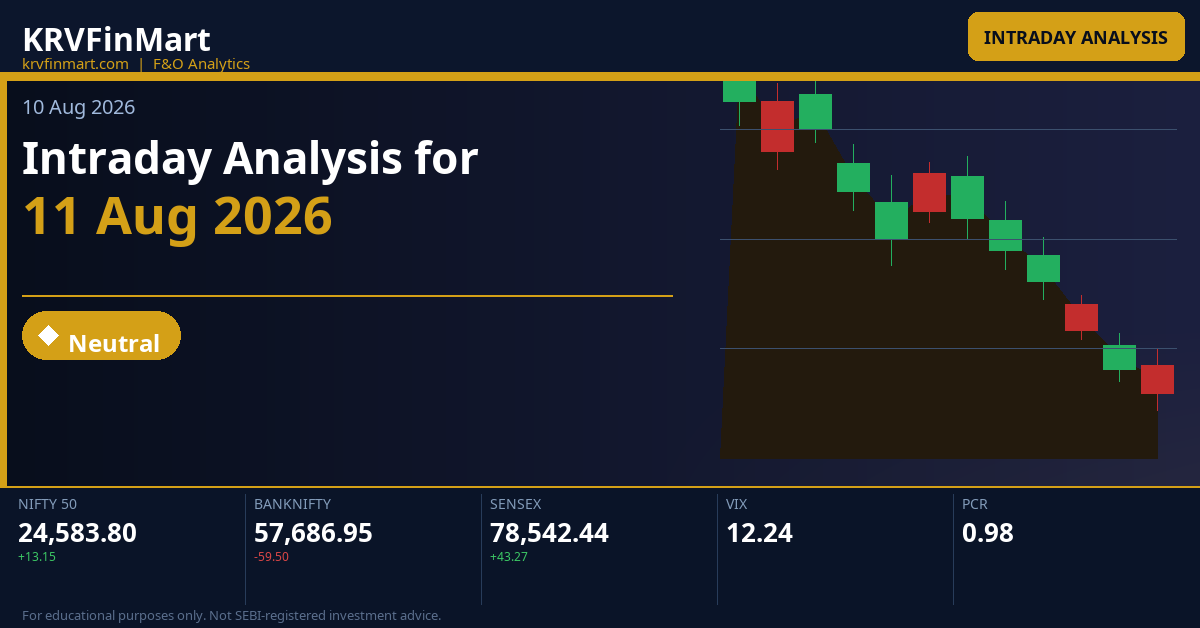
Markets closed virtually flat on 10 Aug 2026, with NIFTY adding a marginal +0.05% to settle at 24,583.80, BANKNIFTY slipping -0.10% to 57,686.95, and SENSEX inching up +0.06% to 78,542.44, painting a picture of indecision heading into the 11 Aug session. India VIX data is unavailable for this session, which limits volatility-adjusted position sizing; traders should default to using straddle pricing as the proxy for expected daily range — NIFTY's weekly straddle of 147.9 points defines the ±0.60% band the options market is pricing for the expiry week. All three indices carry narrow CPR bands (0.05%–0.10%), which historically correlates with high-probability trending days where the first 15-minute directional break tends to define the session, making the opening gap and immediate CPR interaction the single most critical variable to monitor at the 9:15 open.
Key Market Signals — Intraday Setup
All three indices open Monday's session with their Day CPR bands sitting within striking distance of Friday's close — NIFTY's Outside-Narrow CPR engulfs the prior range while BANKNIFTY's Descending-Narrow CPR sits below the prior close, creating a subtle divergence where NIFTY has structural compression energy while BANKNIFTY leans bearish; SENSEX's Overlapping-Narrow CPR adds a third, balanced dimension, and the consensus picture is one of a market coiled for a directional trending move — the first 15-minute candle across all three charts will likely determine whether Monday sees a coordinated breakout or a multi-index breakdown.
Deep Technical Analysis & Levels
NIFTY
Outside — Narrow (Width 0.05%)
◆ Neutral
Market Structure Trending (up or down trend) | Straddle Weekly ATM 24600 straddle priced at **147.9 points** (Call 73.25 + Put 74.65), implying an expected intraday move of approximately ±73–74 points from 24,600, which maps the day's likely range to roughly 24,526–24,674; the monthly straddle at 448.5 points confirms the broader swing range is significantly wider, suggesting short-term options are pricing a compressed near-term view. | Max Pain Weekly max pain at **24,600** and monthly max pain at **24,500** create a gravitational pull toward 24,500–24,600 for option sellers; price spending time near 24,583 into this week's expiry strongly benefits net short-gamma positions, and any directional move away from 24,600 will be contested by dealers re-hedging delta. |
Tomorrow's Complete Level Map
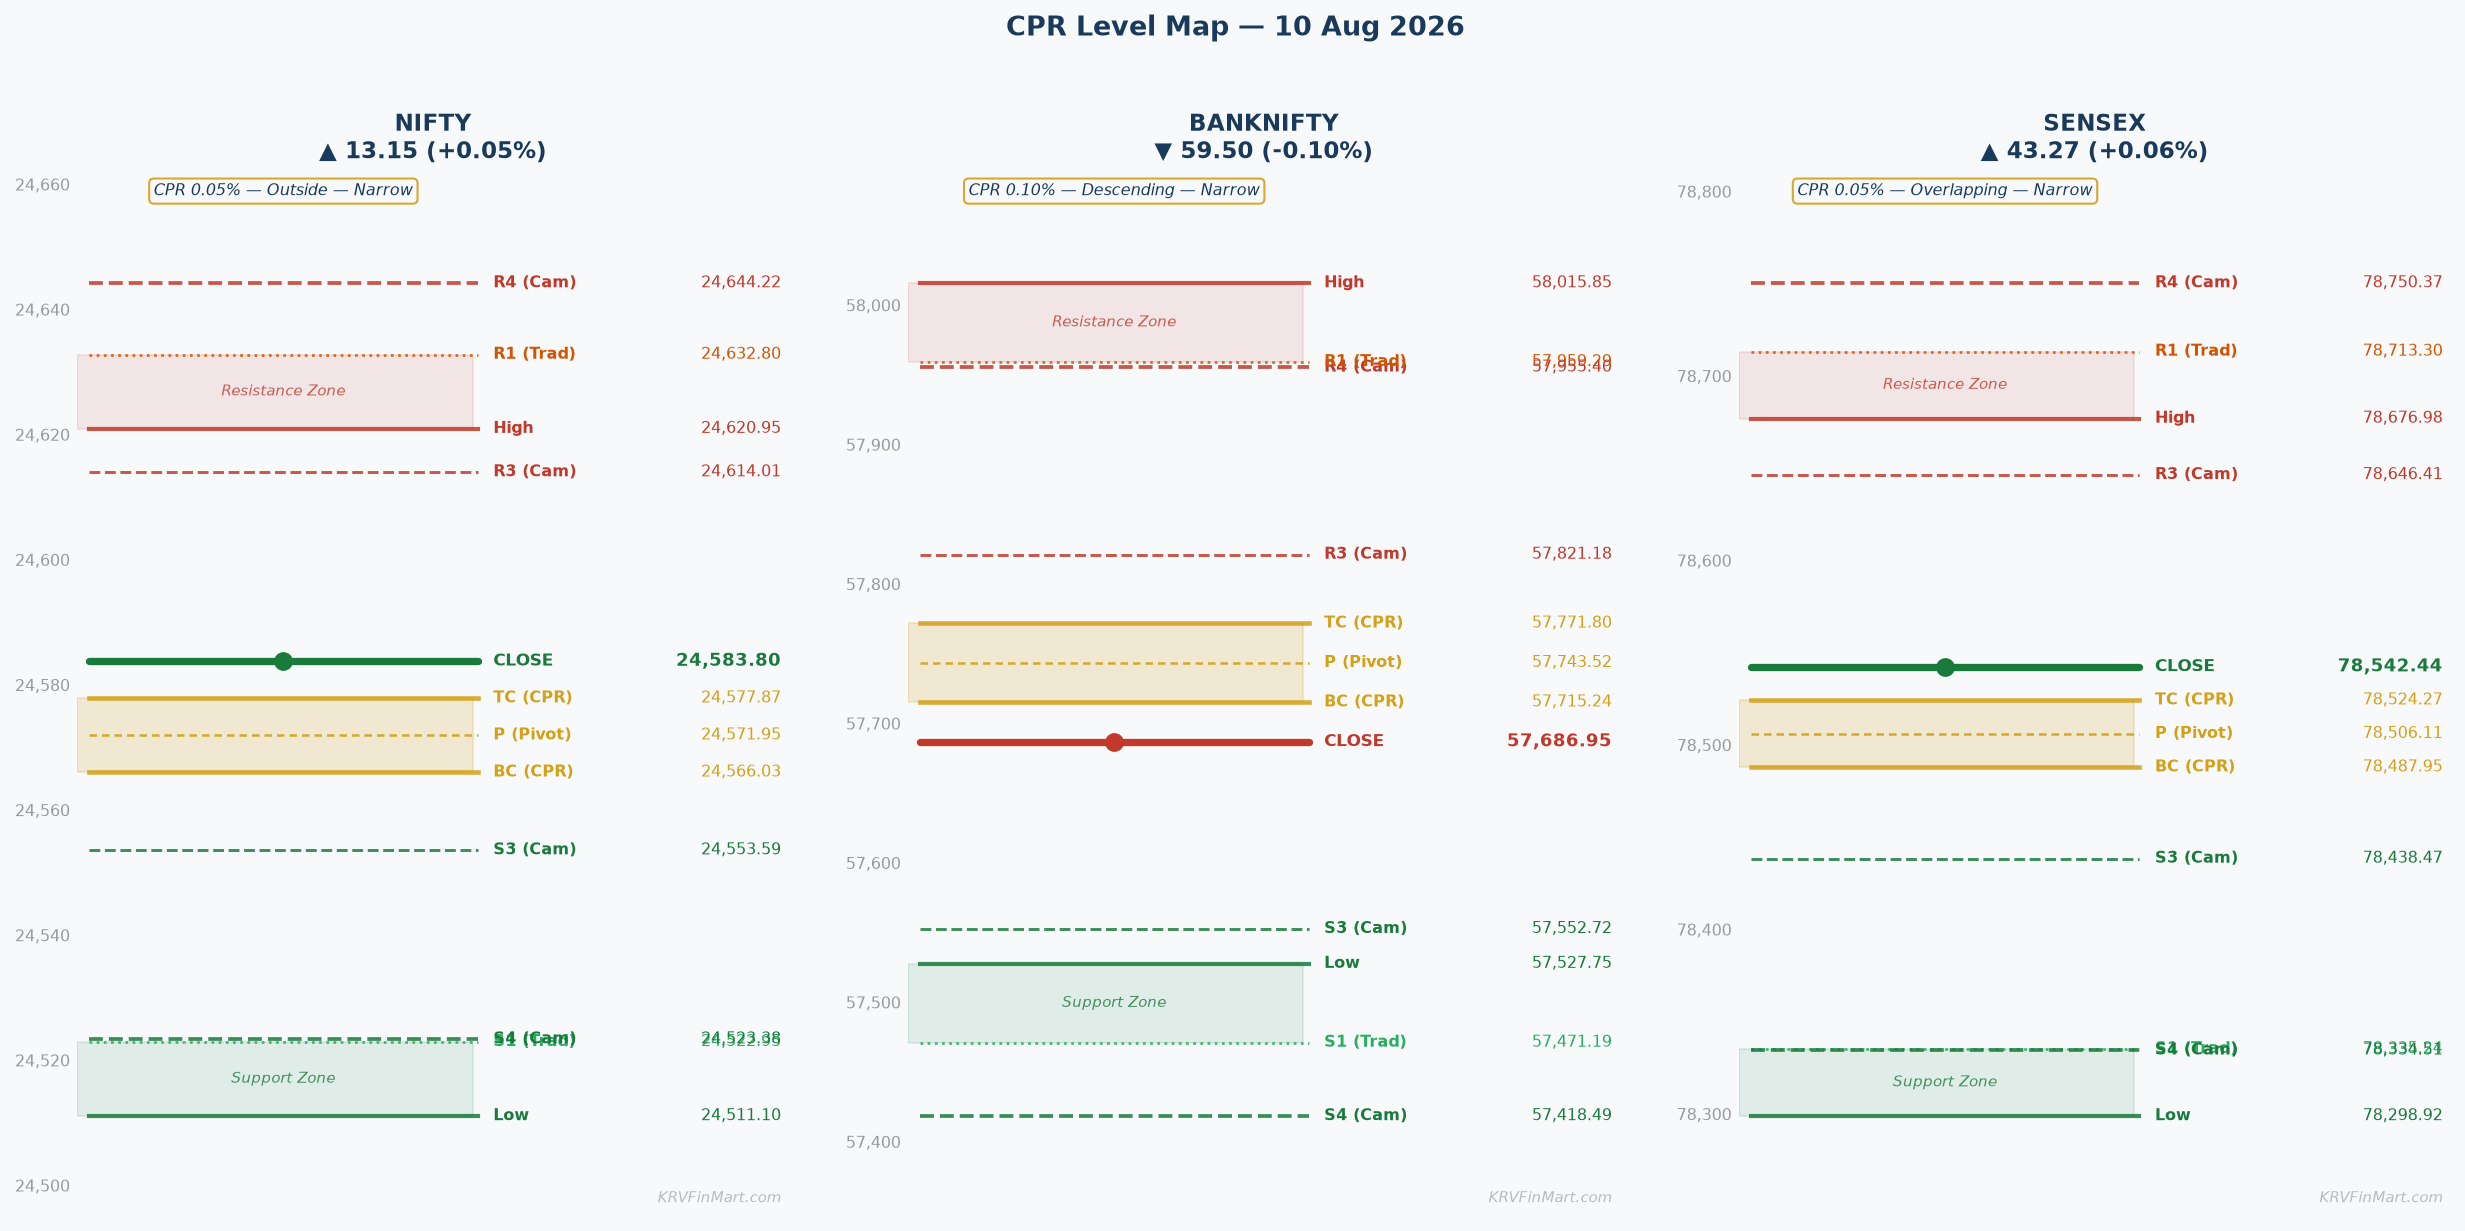
OI-R: 24,600 R3: 24,742.65 H6: 24,693.98 H5: 24,679.51 R2: 24,681.80 H4 ▶: 24,644.22 R1: 24,632.80 PDH: 24,620.95 H3 ↩: 24,614.01
TC: 24,577.87 P: 24,571.95 BC: 24,566.03
L3 ↩: 24,553.59 PDL: 24,511.10 S1: 24,522.95 L4 ▶: 24,523.38 S2: 24,462.10 L5: 24,488.09 L6: 24,473.62 S3: 24,413.10 OI-S: 24,500
↩ = Camarilla reversal point | ▶ = Camarilla breakout/breakdown trigger | OI-R/OI-S = Options wall (CE/PE max OI)
▲ Higher Open (Gap Up) — Open > Prev Close
▲ Bullish
Open lands: With an Outside-Narrow CPR that engulfs the prior range (BC 24,566.03 to TC 24,577.87 sits well within Friday's high-low range of 24,511.10–24,620.95), a gap-up open above the prev close of 24,583.80 will push price above TC 24,577.87 immediately, placing the open above the entire CPR band; minor gaps land in the 24,584–24,645 zone between TC and PDH/H4, while significant gaps push toward PDH 24,620.95 and the OI resistance wall at 24,600.
CPR role: In a gap-up scenario with Outside-Narrow CPR, the CPR band (BC 24,566.03–TC 24,577.87) immediately flips to an intraday support zone beneath the open price; price is above the entire CPR band from the first tick, and any intraday pullback that holds TC 24,577.87 acts as a launch pad for continuation, while a failure through BC 24,566.03 signals the gap-up was a trap door — sellers absorbed the gap and are pressing lower.
Minor Gap (0.05–0.25%) — Structure Dominant
A minor gap-up of 0.05%–0.25% places the open in the 24,584–24,643 range, essentially threading the needle between TC 24,577.87 and the critical OI resistance at 24,600 — this is the most technically loaded zone for Monday's session given that max pain also sits at 24,600. The Outside-Narrow CPR structure adds a subtle bullish lean since the CPR band is compressed (only 11.84 points wide) and price has already cleared TC 24,577.87, meaning the CPR band beneath acts as an immediate net below, reducing mean-reversion downside in the first 15 minutes. The first 15-minute candle close above the OI resistance ceiling at 24,600 — which coincides with H3 at 24,614.01 just above — is the critical trigger: a sustained close above 24,600 re-classifies the OI wall from resistance to base and opens the path toward R1 at 24,632.80 and PDH 24,620.95 as the initial partial-profit zone.
Significant Gap (0.25–0.5%) — Balanced
A significant gap of 0.25%–0.50% pushes the open to approximately 24,644–24,706, placing price at or above H4 24,644.22 and directly into the H5 24,679.51–H6 24,693.98 Camarilla target zone — this means price is opening INTO the upper Camarilla extension, a classic mean-reversion warning zone. Gap-fill risk is elevated because the OI resistance at 24,600 and PDH 24,620.95 are now BELOW the open price, meaning a failure to hold H4 24,644.22 would see a rapid flush toward OI resistance-turned-support at 24,600 and then TC 24,577.87. Delta-hedging flows from CE writers who sold the 24,600 strike will create significant supply near 24,644–24,679, and unless accompanied by outsized buying volume, the high-probability trade is a fade from H4/H5 zone back toward 24,600 or TC 24,577.87, targeting an initial 30–40 point mean-reversion scalp.
Large Gap (>0.5%) — Gap Direction Dominant
A large gap-up exceeding 0.50% carries price above 24,706 and into or beyond H6 24,693.98, which is the extreme Camarilla extension — territory where the probability distribution strongly favors gap-fill and mean-reversion over continuation, especially in the context of a weekly straddle pricing only 147.9 points of total expected movement. Opening above H6 24,693.98 means the market has pre-consumed a significant portion of the weekly expected range in pre-market activity alone, creating a scenario where longs from Friday will be booking profits aggressively, CE writers at 24,700–25,000 will be delta-shorting, and the risk-reward for chasing the gap up becomes highly unfavorable. The abort level for any residual long position is H4 24,644.22 — a first 15-minute close below this level confirms gap-fill resumption toward OI resistance-turned-support at 24,600, with the weekly straddle's upper band at approximately 24,748 acting as the absolute upside ceiling before sellers overwhelm.
|
▲ Upside Path → OI-R The upside continuation path from above OI-R 24,600 reads: **H3 24,614.01 → PDH 24,620.95 → R1 24,632.80 → H4 24,644.22**, where each level represents a natural partial-profit zone — H3 24,614.01 is the Camarilla mean-reversion ceiling that becomes a momentum launch pad once cleared, PDH 24,620.95 is prior day's high and a natural stop-run target where breakout traders will enter, and R1 24,632.80 is the first Traditional target where longs should take their first partial profit per the Narrow CPR confirmation rule. Above R1, the cluster of H4 24,644.22, H5 24,679.51, and R2 24,681.80 forms a second resistance band where the weekly straddle upper boundary (approximately 24,748) and R3 24,742.65 define the absolute session ceiling for trending day bulls. |
▼ Downside Path → OI-S A failure to hold the CPR band in a gap-up scenario — specifically a first 15-minute close back below TC 24,577.87 after gapping above it — is a structural reversal signal that invalidates the gap-up bull thesis entirely; the failure path reads **TC 24,577.87 → P 24,571.95 → BC 24,566.03 → L3 24,553.59 → L4 24,523.38 → OI-S 24,500**, with L3 24,553.59 being the first Camarilla mean-reversion support where bears should take a partial and reassess, and OI-S 24,500 representing the weekly PE max OI wall where PE writers will defend aggressively, likely containing the downside for the session unless broader risk-off accelerates. |
| 🔴 OI-R: OI-R at **24,600** in a gap-up scenario functions as the primary intraday ceiling and the most important single price level of the session — this is where the highest concentration of call options have been written for the weekly expiry, meaning market makers are short gamma here and will delta-sell into every price advance toward this strike, creating a self-reinforcing supply zone. If this wall is genuinely breached on high volume and a 15-minute close above 24,600 is confirmed, the short-gamma dynamic inverts — CE writers must buy futures to hedge newly in-the-money calls, creating a mechanical buying cascade that can propel price sharply toward R1 24,632.80 and beyond; this transition from resistance to propellant is the highest-reward setup in the gap-up scenario. | 🟢 OI-S: OI-S at **24,500** is the weekly PE max OI strike, meaning the largest concentration of put options written sits here — in a gap-up scenario, this level is far below the open price and primarily serves as an abort level rather than an active intraday reference; however, if the gap-up completely fails and price collapses more than 80 points from the open, OI-S 24,500 becomes the gravitational target where PE writers will defend their positions by buying futures, and the confluence of L5 24,488.09, L6 24,473.62, and S1 24,522.95 in the 24,488–24,523 zone just above OI-S creates a structural support cluster that should contain the downside unless a major fundamental shock is in play. |
⚡ Key Trigger: The critical trigger in a gap-up scenario is the **first 15-minute candle close above OI-R at 24,600** — this level is simultaneously the max pain strike, the CE OI wall, and the psychological round-number resistance, making it the single most important intraday fulcrum; a decisive 15-minute close above 24,600 backed by above-average volume signals that CE writers are being forced to cover, delta-hedging flows turn supportive, and the path clears toward H3 24,614.01, PDH 24,620.95, and R1 24,632.80. If price opens above 24,600 but the first 15-minute candle fails to HOLD above 24,600 (i.e., closes back below it), the setup flips bearish-immediately — CE writers have successfully defended their wall, and the pullback toward TC 24,577.87 and BC 24,566.03 becomes the high-probability intraday trade.
▼ Lower Open (Gap Down) — Open < Prev Close
▼ Bearish
Open lands: A gap-down open below the prev close of 24,583.80 drops price below the entire CPR band (TC 24,577.87–BC 24,566.03) almost immediately — minor gaps of 0.05%–0.25% land the open in the 24,522–24,583 zone between BC and S1/L4, while significant gaps push below L3 24,553.59 toward the PDL 24,511.10 and the OI support at 24,500; with an Outside-Narrow CPR, the CPR band above the open price acts as immediate overhead resistance rather than support.
CPR role: In a gap-down scenario with Outside-Narrow CPR, the CPR band (BC 24,566.03–TC 24,577.87) flips to overhead resistance — bulls must reclaim BC 24,566.03 first, then P 24,571.95, and finally TC 24,577.87 to neutralise the bearish pressure; until BC 24,566.03 is reclaimed on a 15-minute close, the CPR band acts as a ceiling suppressing any attempted recovery rally.
Minor Gap (0.05–0.25%) — Structure Dominant
A minor gap-down of 0.05%–0.25% places the open in the 24,522–24,583 range, specifically between BC 24,566.03 and S1 24,522.95/L4 24,523.38 — a cluster of Camarilla and Traditional supports that historically generates intraday bounce attempts within the first 30 minutes. The CPR band sitting only 3–44 points above the open price means that the gap-fill trade (long from open targeting BC 24,566.03 reclaim) is tempting, but the Narrow CPR width of 0.05% and Trending structure means that if BC 24,566.03 is NOT reclaimed in the first 15-minute candle, the probability of a sustained bear trend for the full session rises sharply. The bear scenario targets L3 24,553.59 as first stop, then PDL 24,511.10 and L4 24,523.38 as the second cluster, and finally OI-S 24,500 as the key session low target where PE writer defense should provide a floor.
Significant Gap (0.25–0.5%) — Balanced
A significant gap-down of 0.25%–0.50% takes the open to approximately 24,462–24,522, placing price at or below S1 24,522.95 and L4 24,523.38 — both critical support levels that act as the last structural defense before PDL 24,511.10 and the psychological round-number OI support at 24,500. In this scenario, gap-fill probability is lower because price has broken below multiple structural supports simultaneously, and put option writing at 24,500 creates PE buying in futures that may provide a bounce, but a 30-minute candle that fails to reclaim L4 24,523.38 confirms the failure-and-resume bear pattern with L5 24,488.09 and L6 24,473.62 as next targets. The PUT writing context is crucial here: heavy PE OI at 24,500 means market makers are long 24,500 puts (delta = -0.4 to -0.5), requiring them to sell futures as price approaches, creating a perverse supply dynamic that can accelerate the decline toward OI-S 24,500 and even S2 24,462.10 if panic sets in.
Large Gap (>0.5%) — Gap Direction Dominant
A large gap-down exceeding 0.50% carries the open below 24,461, breaking below S2 24,462.10 and L5 24,488.09, entering what is effectively the panic zone for the weekly expiry with only 147.9 straddle points separating the entire expected range; opening below S2 24,462.10 means the weekly straddle lower boundary (approximately 24,452) has already been breached, suggesting a major macro catalyst is driving the move and normal mean-reversion rules are suspended. The recovery test in this scenario requires reclaiming L5 24,488.09 first, then L4 24,523.38 — neither of which should be assumed easy given the sell-side momentum; the primary target for bears remains OI-S 24,500 even if it seems close to the open, because the concentration of PE OI there creates a magnet-and-then-collapse dynamic (price approaches 24,500, PE writers defend briefly, but if it breaks, the mechanical delta-selling accelerates toward S3 24,413.10). Straddle monetisation via buying puts or selling calls above the open price is the primary professional strategy in this scenario, with the abort level for bears being any 15-minute close back above L4 24,523.38.
|
▲ Upside Path → OI-R The recovery path in a gap-down scenario reads **BC 24,566.03 → P 24,571.95 → TC 24,577.87 → OI-R 24,600 → H3 24,614.01**, where each reclaim represents a structural shift from bearish to neutral to bullish; genuine recovery is confirmed only when TC 24,577.87 is cleared and held on a 15-minute close, at which point the CPR band has been fully reclaimed and the gap-fill trade targets OI-R 24,600 as the session ceiling where partial profits should be taken. Above OI-R 24,600, confirmation of a full gap-fill recovery requires a close above H3 24,614.01, after which PDH 24,620.95 and R1 24,632.80 become the stretch targets for aggressive bulls willing to hold into the afternoon session. |
▼ Downside Path → OI-S The bear continuation path in gap-down reads **L3 24,553.59 → PDL 24,511.10 → L4 24,523.38 → L5 24,488.09 → OI-S 24,500**, with L3 24,553.59 acting as the first Camarilla bear target where short-sellers should book partial profits and reassess — retail stop-losses typically cluster just below L3 (approximately 24,545–24,550), and triggering those stops creates an accelerated cascade toward PDL 24,511.10 and the L4/S1 cluster at 24,523.38–24,522.95. Below PDL 24,511.10, the L5 24,488.09–OI-S 24,500 zone is the primary destination for the session where PE writers will mechanically defend (buy futures to reduce delta), creating a high-probability floor — but if that floor fails on sustained volume, S2 24,462.10 and L6 24,473.62 become the final intraday supports before a much larger structural move is confirmed. |
| 🔴 OI-R: OI-R at **24,600** in a gap-down scenario functions as the primary overhead resistance ceiling for any recovery attempt — CE writers who positioned here are now comfortably out-of-the-money and have no immediate delta-hedging pressure, meaning they can afford to sell any rallies that approach 24,600, reinforcing the level as supply; the net effect is that 24,600 acts as a 'short-the-rip' reference for professional traders managing gamma exposure, and any recovery that stalls at 24,600 without a volume surge should be treated as a signal to add to or reinstate short positions. The gap between the gap-down open and OI-R 24,600 defines the maximum gap-fill extent — only a move back above 24,600 on a confirmed 15-minute close with above-average volume genuinely neutralises the bearish gap-down structure. | 🟢 OI-S: OI-S at **24,500** is the weekly PE max OI strike and the single most critical downside reference in a gap-down scenario — it is both the primary bear target AND the primary mechanical support floor, creating a dual dynamic where price approaching 24,500 triggers PE writer delta-buying (supportive) while simultaneously representing the monetisation target for hedgers who bought puts at higher strikes. Reaching OI-S 24,500 creates a tactical decision point: if the daily candle closes at or above 24,500, PE writers have successfully defended their wall and the position squares; if 24,500 is broken with volume, the mechanical delta-selling from those same PE writers (now forced to sell more futures as puts go deeper ITM) can create a rapid extension toward L5 24,488.09, L6 24,473.62, and S2 24,462.10. |
⚡ Key Trigger: The primary bear trigger in a gap-down scenario is **failure to reclaim BC 24,566.03 within the first 15 minutes** — as long as BC 24,566.03 remains above price as resistance, the CPR band acts as a ceiling and the day's directional structure is unambiguously bearish; the bull trigger conversely is a **first 15-minute candle close back above BC 24,566.03**, which initiates the gap-fill recovery sequence toward P 24,571.95, TC 24,577.87, and ultimately OI-R 24,600. The significance of BC 24,566.03 as the trigger is amplified by the Narrow CPR width — with only 11.84 points between BC and TC, any close above BC rapidly pulls price toward TC, meaning the entire CPR band can be reclaimed in a single 15-minute candle, converting the day from bearish to neutral or bullish with unusual speed.
◆ Near Flat Open — Open ≈ Prev Close (±0.05%)
◆ Neutral
Open lands: A flat open within ±0.05% of prev close 24,583.80 places the open in the 24,571–24,596 range — critically, this lands the open ABOVE TC 24,577.87 and above BC 24,566.03, meaning price starts the session already above the entire Outside-Narrow CPR band; however, with the open so close to TC 24,577.87, any initial weakness could rapidly pull price back into the CPR band, making the CPR band a decision zone rather than a confirmed support.
CPR role: In a flat-open scenario with Outside-Narrow CPR, the CPR band (BC 24,566.03–TC 24,577.87) serves as an immediate decision zone and compression band — the fact that price is barely above the CPR band means that any 15-minute candle that closes back below TC 24,577.87 signals failed bullish momentum and initiates the bear scenario; conversely, holding above TC 24,577.87 for the first two 15-minute candles confirms the CPR as a launch pad from which the day's trend will develop.
Near Flat (±0.05%)
Flat opens in a Narrow CPR environment (0.05% wide) are among the highest-information setups in intraday trading — the CPR band is so compressed (only 11.84 points between BC 24,566.03 and TC 24,577.87) that any directional movement away from it tends to be sustained and trending for the majority of the session, with the first 15-minute candle IS the trade signal per the Narrow confirmation rule. A first 15-minute close **above TC 24,577.87** confirms bull control: the CPR band becomes support beneath, and the path opens toward H3 24,614.01, OI-R 24,600 (the primary upside ceiling), and PDH 24,620.95 — while a first 15-minute close **below BC 24,566.03** confirms bear control: the CPR band becomes overhead resistance and the path opens toward L3 24,553.59, PDL 24,511.10, and OI-S 24,500. The Outside-Narrow CPR type — where the CPR band engulfs the prior day's range in terms of its positioning — creates the compression energy dynamic: the prior session's entire range is essentially 'inside' the structural context of today's CPR, meaning pent-up directional energy is waiting for a trigger. The probability of a trending day (either sustained bull or sustained bear from the first 15 minutes) is HIGH given the Narrow width, and the key insight for traders is that there is no 'fade the CPR' trade in a flat-open Narrow scenario — the trade IS the breakout, and it should be entered on the first 15-minute close confirmation rather than waited out; both the bull trigger (close above TC 24,577.87) and bear trigger (close below BC 24,566.03) target a minimum of 40–60 points on the first leg, consistent with the weekly straddle pricing of 147.9 total points.
|
▲ Upside Path → OI-R The bull path from a flat open reads **TC 24,577.87 → H3 24,614.01 → OI-R 24,600 → PDH 24,620.95 → R1 24,632.80 → H4 24,644.22**, with TC 24,577.87 as the launch pad confirmation, H3 24,614.01 as the first Camarilla target where the first partial profit should be booked (Narrow rule), and OI-R 24,600 as the primary ceiling where CE writers create supply — note that H3 24,614.01 is actually ABOVE OI-R 24,600, meaning the sequencing is OI-R 24,600 first, then H3 24,614.01, and a break above H3 opens the path to PDH 24,620.95 and R1 24,632.80 as the next partial zone. Above R1 24,632.80, the H4 24,644.22 level acts as the Camarilla breakout trigger — a close above H4 in the afternoon session targets H5 24,679.51 and H6 24,693.98 as the trending day extension, consistent with the monthly Camarilla H3 at 24,637.86 providing additional confluence in this zone. |
▼ Downside Path → OI-S The bear path from a flat open reads **BC 24,566.03 → L3 24,553.59 → PDL 24,511.10 → L4 24,523.38 → OI-S 24,500 → L5 24,488.09**, with BC 24,566.03 as the breakdown confirmation, L3 24,553.59 as the first Camarilla bear target for partial profit booking (13 points below BC — consistent with the straddle's implied range), and the PDL 24,511.10 and L4/S1 cluster at 24,522.95–24,523.38 as the second major support where a reassessment of position size is warranted. OI-S 24,500 is the anchor for the bearish trend day — PE writers defending this level will create a tactical pause, and the risk-reward for holding short positions below 24,500 diminishes sharply unless L5 24,488.09 and L6 24,473.62 are taken out sequentially with volume, which would signal a genuine trending bear day rather than a mean-reversion selloff. |
| 🔴 OI-R: OI-R at **24,600** in a flat-open scenario is the primary upside ceiling and the max pain gravity center — CE writers who positioned at this strike are writing calls near the current price, creating significant gamma supply that will resist any breakout above 24,600 until expiry approaches or a major catalyst forces covering; in a flat-open narrow CPR day, 24,600 effectively acts as the session's 'magnetic' resistance where price may gravitate but struggle to sustain above, making it the ideal first partial-profit zone for bulls and the initiation zone for CE-selling strategies by experienced option writers. The confluence of OI-R 24,600 with max pain 24,600 and Camarilla H3 24,614.01 just above creates a three-layer resistance cluster between 24,600 and 24,614 that is the most important decision zone of the entire session for longs. | 🟢 OI-S: OI-S at **24,500** in a flat-open scenario is the primary downside gravitational anchor — PE writers at this weekly strike represent the market's collective assessment of a key support floor, and their delta-hedging requirements (buying futures as price falls toward 24,500) create a mechanical support dynamic that should hold for the session absent a major shock; in the flat-open CPR context, OI-S 24,500 is approximately 83 points below the open, which is well within the weekly straddle's expected range of 147.9 points, meaning 24,500 is a realistic bear target on a trending-down day and traders should position stops accordingly — bear positions entered at BC 24,566.03 breakdown should carry targets to OI-S 24,500 with a trailing stop technique using L3 24,553.59 and L4 24,523.38 as steppingstones. |
⚡ Key Trigger: The exact dual trigger for the flat-open scenario is: **Bull — first 15-minute candle close above TC 24,577.87** initiates the bullish trend day structure targeting H3 24,614.01 and OI-R 24,600; **Bear — first 15-minute candle close below BC 24,566.03** initiates the bearish trend day structure targeting L3 24,553.59 and OI-S 24,500. TC 24,577.87 and BC 24,566.03 are the structural fulcrum of the session because, in a Narrow CPR environment, the market maker community and institutional algos treat a close above/below these levels as a directional trend signal, triggering momentum-chasing flows that are self-reinforcing until the next major structural level (OI-R or OI-S) is reached; the 11.84-point CPR band width means a decisive 15-minute candle can simultaneously trigger both the bull camp's entries AND the bear camp's stop-losses (or vice versa), amplifying the initial directional move.
BANKNIFTY
Descending — Narrow (Width 0.10%)
▼ Bearish
Market Structure Trending (up or down trend) | Straddle Monthly ATM 57700 straddle priced at **1215.75 points** (Call 674.25 + Put 541.5), implying an expected move of approximately ±607 points from 57,700 for the monthly expiry, defining a broad range of 57,093–58,307; for intraday purposes, the daily expected move is approximately ±200–250 points (scaling the monthly straddle), making the CPR band of 57,715.24–57,771.80 effectively a 56-point zone within a much larger structural battleground. | Max Pain Monthly max pain at **58,000** sits approximately 313 points above Friday's close of 57,686.95, creating an upward gravitational pull for option sellers over the monthly expiry horizon; however, for Monday's intraday session, the Descending-Narrow CPR structure implies near-term bearish bias that conflicts with the monthly max pain pull, creating a tension between short-term CPR direction and longer-term max pain gravity that experienced traders should note. |
Tomorrow's Complete Level Map
OI-R: 58,000 R3: 58,447.39 H6: 58,176.40 H5: 58,112.17 R2: 58,231.62 H4 ▶: 57,955.40 R1: 57,959.29 PDH: 58,015.85 H3 ↩: 57,821.18
TC: 57,771.80 P: 57,743.52 BC: 57,715.24
L3 ↩: 57,552.72 PDL: 57,527.75 S1: 57,471.19 L4 ▶: 57,418.49 S2: 57,255.42 L5: 57,261.71 L6: 57,197.50 S3: 56,983.09 OI-S: 57,000
↩ = Camarilla reversal point | ▶ = Camarilla breakout/breakdown trigger | OI-R/OI-S = Options wall (CE/PE max OI)
▲ Higher Open (Gap Up) — Open > Prev Close
↕ Conflicted
Open lands: With a Descending CPR (TC 57,771.80 < prev_BC, which means the entire CPR band sits below Friday's price zone in structural terms), a gap-up open above prev close 57,686.95 pushes price ABOVE TC 57,771.80 — this is the 'above entire descending CPR' scenario that signals potential trend reversal energy; the open in a minor gap-up lands in the 57,687–57,830 range (above TC but below H3 57,821.18), while a significant gap-up brings price toward PDH 58,015.85 and OI-R 58,000.
CPR role: In a Descending-Narrow CPR gap-up scenario, the CPR band (BC 57,715.24–TC 57,771.80) flips to an intraday support zone beneath the open — the opening price above TC 57,771.80 is a structurally significant event because the Descending CPR type typically signals that the market is below its prior CPR (bearish continuation), so gapping above TC challenges that thesis and the CPR band beneath acts as a critical must-hold support for bulls; if BC 57,715.24 is lost after a gap-up open, the Descending CPR structure reasserts bearish control with a vengeance.
Minor Gap (0.05–0.25%) — Structure Dominant
A minor gap-up of 0.05%–0.25% places the open in the 57,687–57,831 range, which lands either just above TC 57,771.80 (if near the upper end) or between BC 57,715.24 and TC 57,771.80 (inside the CPR band if gap is minimal), creating an immediate tension between the gap-up momentum and the Descending CPR's structural bearish bias. The Descending Narrow CPR structure means that the CPR band is the 'wrong side' of where the trend says price should be — opening above TC 57,771.80 challenges the established bearish structure, but the Narrow width (0.10%) means this challenge is thin and a single 15-minute failure candle can rapidly pull price back below TC 57,771.80 and into bearish territory. The first critical target for bulls is H3 57,821.18 — a 15-minute close above H3 57,821.18 signals the Descending CPR's bearish bias is being genuinely overridden and opens the path toward R1 57,959.29 and PDH 58,015.85; below TC 57,771.80, the bear trade resumes targeting L3 57,552.72.
Significant Gap (0.25–0.5%) — Balanced
A significant gap-up of 0.25%–0.50% pushes the open to approximately 57,830–57,974, placing price well above TC 57,771.80 and approaching H4 57,955.40 and R1 57,959.29 — a zone where Camarilla breakout signals and Traditional first targets converge, creating a formidable resistance cluster. The Descending CPR structure creates a gap-fill risk even in a significant gap-up because the broader trend was bearish into Friday's close; the gap-fill scenario has BC 57,715.24 as the initial pullback target (approximately 120–260 points below the gap-up open), which is well within a normal intraday retracement. Delta-hedging from CE writers at the 58,000 OI-R level — which is now only 26–144 points above the significant gap-up open — will create meaningful supply, and the primary tactical question is whether H4 57,955.40 and OI-R 58,000 act as a combined ceiling (fade) or a combined launch pad (momentum entry above 58,000), with the monthly max pain at 58,000 adding gravitational significance to this level.
Large Gap (>0.5%) — Gap Direction Dominant
A large gap-up exceeding 0.50% carries the open above 57,972 and directly into or above the critical OI-R at 58,000 and H4 57,955.40 — opening at or above the monthly max pain level of 58,000 in the context of a Descending CPR is a rare and high-impact event that warrants extreme caution; this means the market is opening above where option sellers most want it to be, creating complex hedging dynamics. In this scenario, the Descending CPR's BC 57,715.24 is now 285+ points below the open — well outside the daily expected range — suggesting the gap-up is driven by a genuine fundamental catalyst rather than normal overnight repositioning; bear traders should wait for a confirmed 15-minute close back below H4 57,955.40 before fading, while bulls should scale into longs only above PDH 58,015.85 with stops at OI-R 58,000, targeting H5 58,112.17 and H6 58,176.40. The weekly straddle's upper boundary at approximately 58,238 (implied by monthly straddle scaling) provides the absolute ceiling reference, beyond which a reversal to gap-fill becomes statistically dominant.
|
▲ Upside Path → OI-R The bull continuation path from a confirmed gap-up reads **H3 57,821.18 → H4 57,955.40 → R1 57,959.29 → OI-R 58,000 → PDH 58,015.85 → H5 58,112.17**, where H3 57,821.18 is the first partial-profit zone (Narrow rule: first 15-min close above), H4 57,955.40 and R1 57,959.29 form a twin resistance cluster just below OI-R 58,000 where a second partial should be booked, and OI-R 58,000 is the monthly max pain and CE OI wall that will create the strongest supply in the session. A confirmed breakout above OI-R 58,000 — requiring a 15-minute close above PDH 58,015.85 — targets H5 58,112.17 as the next Camarilla extension zone, but this scenario has a lower probability given the Descending CPR's underlying bearish bias and CE writer positioning at 58,000. |
▼ Downside Path → OI-S A failure in the gap-up scenario pulls price through the Descending CPR band with bearish intensity: **TC 57,771.80 → BC 57,715.24 → L3 57,552.72 → PDL 57,527.75 → L4 57,418.49 → OI-S 57,000**, with the breach of BC 57,715.24 being the highest-conviction short entry signal — at that point, the Descending CPR structure is fully in control and retail longs from the gap-up are being stopped out, adding fuel to the decline. Below PDL 57,527.75, L4 57,418.49 and S1 57,471.19 form the intermediate support cluster where partial covers are warranted, and OI-S 57,000 is the monthly PE max OI wall approximately 687 points from Friday's close — a move to OI-S 57,000 on a single intraday session would consume a large portion of the monthly straddle pricing and represents an extreme bear scenario. |
| 🔴 OI-R: OI-R at **58,000** in a gap-up scenario is both the monthly max pain level AND the highest CE OI concentration for the monthly expiry — this creates a double-gravity ceiling effect where option sellers (who want price at 58,000 at expiry) are simultaneously selling delta into price advances toward 58,000, making it the most important single level in BANKNIFTY for August 2026; in a gap-up scenario that approaches or reaches 58,000, the CE writer delta-selling pressure is intense and probability of sustained trading above 58,000 without a major catalyst is low. However, if 58,000 is broken with conviction and a 15-minute close is achieved above PDH 58,015.85, the forced short-covering from CE writers creates an explosive move toward H5 58,112.17 and H6 58,176.40, which would represent the 'gamma squeeze' scenario that BankNifty is periodically susceptible to. | 🟢 OI-S: OI-S at **57,000** in a gap-up scenario is a distant 687-point floor that serves primarily as the catastrophic abort level and the ultimate bear target if the Descending CPR thesis plays out with maximum severity; in the context of a gap-up open, OI-S 57,000 is irrelevant unless the gap-up completely fails AND the subsequent decline accelerates through L4 57,418.49 and S2 57,255.42 — only then does 57,000 come into play as the monthly PE writer defense zone where mechanical futures buying should create a floor. The weekly CPR for BANKNIFTY shows L5 57,261.71 and L6 57,197.50 sitting between 57,200–57,262 and providing structural support above OI-S 57,000, meaning that even in extreme bear scenarios, the L5/L6 cluster tends to provide at least a tactical pause before any approach to the 57,000 OI floor. |
⚡ Key Trigger: The critical trigger in a BANKNIFTY gap-up scenario is **first 15-minute candle close above H3 57,821.18** — this Camarilla mean-reversion level is the structural fulcrum that separates a 'gap-up that holds and trends' from a 'gap-up that fails and mean-reverts back through the Descending CPR'; above H3 57,821.18, the Descending CPR's bearish narrative is suspended and the path toward R1 57,959.29 and OI-R 58,000 opens with momentum-chasing algo flows reinforcing the move. The failure scenario is a 15-minute close back below TC 57,771.80 after a gap-up open — this confirms the Descending CPR's bearish structural bias is reasserting, the gap-up was a trap for retail bulls, and the path toward L3 57,552.72 and OI-S 57,000 resumes with the added velocity of trapped long positions being liquidated.
▼ Lower Open (Gap Down) — Open < Prev Close
▼ Bearish
Open lands: With a Descending CPR, a gap-down open below prev close 57,686.95 is the 'gap down = inside or below CPR' scenario per the Descending CPR framework — a minor gap-down places the open inside the CPR band (BC 57,715.24–TC 57,771.80) if the gap is minimal, or below BC 57,715.24 if more pronounced; a significant gap-down places the open below BC 57,715.24 and potentially at or below L3 57,552.72, directly confirming the Descending CPR's bearish structural bias with no CPR-reclaim recovery needed.
CPR role: In a Descending-Narrow CPR gap-down scenario, the CPR band acts as overhead resistance in its most powerful form — a gap-down open below BC 57,715.24 means price has never traded inside the CPR band during the session and the entire BC 57,715.24–TC 57,771.80 zone represents a resistance ceiling that bears can sell into on any recovery attempt; the Descending CPR structure combined with a gap-down confirms multi-session bearish momentum, and the narrow width (0.10%) means the resistance band is thin but clearly defined.
Minor Gap (0.05–0.25%) — Structure Dominant
A minor gap-down of 0.05%–0.25% places the open in the 57,543–57,687 range — the lower end of this range (57,543–57,600) lands price below L3 57,552.72, immediately activating the Camarilla bear target zone, while the upper end (57,600–57,687) lands price between L3 57,552.72 and BC 57,715.24, inside the potential recovery zone. In a Descending Narrow CPR with a minor gap-down, the key question is whether price can reclaim BC 57,715.24 — if BC 57,715.24 is not reclaimed in the first 15 minutes, the gap-down has confirmed the Descending CPR's bearish thesis and the day's structure is unambiguously bearish, targeting L3 57,552.72 first and then PDL 57,527.75 as the morning's primary objective. The bear continuation from L3 57,552.72 uses PDL 57,527.75 as the momentum trigger — a 15-minute close below PDL 57,527.75 signals that prior day's range is breaking down and targets L4 57,418.49, S1 57,471.19, and ultimately OI-S 57,000 as the session's bearish macro target.
Significant Gap (0.25–0.5%) — Balanced
A significant gap-down of 0.25%–0.50% drops the open to approximately 57,543–57,543, placing price near or below L3 57,552.72 and well below the entire Descending CPR band — this scenario directly confirms the Descending CPR's bearish structure with no ambiguity, as the gap-down has already cleared BC 57,715.24 and TC 57,771.80 as overhead resistance without any intraday test. Recovery probability in this scenario is materially lower because the gap-down has broken below the prior day's low area (PDL 57,527.75), and PUT writers at 57,000 and 57,500 are now net-delta negative (short delta), requiring them to sell futures as price falls — creating a self-reinforcing decline toward L4 57,418.49, S1 57,471.19, and L5 57,261.71. A 30-minute candle reclaim of L3 57,552.72 is required to neutralise the bear momentum — if achieved, the recovery targets BC 57,715.24 as the session ceiling; if not achieved, the bear continuation accelerates with L4 57,418.49 and S2 57,255.42 as the next major support levels where institutional buyers are likely positioned.
Large Gap (>0.5%) — Gap Direction Dominant
A large gap-down exceeding 0.50% carries the open below 57,400, placing price at or below L4 57,418.49 and S1 57,471.19 — this is an extreme intraday event that signals either a major macro shock (index rebalancing, global risk-off, geopolitical event) or an overnight gap on monthly expiry week that creates maximum gamma pain for option writers at 57,500–58,000 strikes. The panic-vs-recovery dynamic in this scenario is driven by the monthly straddle pricing of 1,215.75 points — a 300+ point gap-down represents approximately 25% of the monthly expected range consumed in pre-market, creating a scenario where straddle buyers from the prior session are immediately in profit and will monetize by selling puts or buying futures to lock in gains, potentially generating a sharp bounce from L4 57,418.49. However, if L4 57,418.49 is breached on volume, the path to L5 57,261.71, L6 57,197.50, and ultimately OI-S 57,000 opens rapidly — bears should target OI-S 57,000 as the primary destination with a trailing stop at L5 57,261.71, as PE writer activity near 57,000 will create the most meaningful intraday support of the session.
|
▲ Upside Path → OI-R The recovery path in a gap-down reads **BC 57,715.24 → P 57,743.52 → TC 57,771.80 → H3 57,821.18 → OI-R 58,000**, with each level representing a sequential resistance that must be absorbed before the next — BC 57,715.24 reclaim confirms gap-fill is underway, P 57,743.52 is the intermediate pivot, TC 57,771.80 is the final CPR reclaim that fully neutralises the bearish Descending CPR structure, and H3 57,821.18 is the Camarilla first resistance where partial profits should be taken. Above H3 57,821.18, genuine bull recovery targets OI-R 58,000 as the monthly max pain and CE OI ceiling, requiring H4 57,955.40 and R1 57,959.29 to be cleared sequentially — this is a high-bar recovery but achievable if morning panic subsides and institutional buying emerges near PDL 57,527.75. |
▼ Downside Path → OI-S The bear continuation path reads **L3 57,552.72 → PDL 57,527.75 → L4 57,418.49 → S1 57,471.19 → L5 57,261.71 → OI-S 57,000**, with L3 57,552.72 as the first Camarilla bear target where partial profits should be locked (Narrow CPR rule: trail after first target), and retail stops clustered just below L3 at approximately 57,540–57,545 accelerating the initial move downward once that level breaks. Below PDL 57,527.75, the L4 57,418.49 and S1 57,471.19 cluster acts as the secondary support zone where aggressive bulls may attempt a counter-trend long (tight stop below L4 57,418.49), but the Descending CPR structure argues against fading the primary trend here — bears should hold with trailing stops at each level until OI-S 57,000 is approached, where PE writer defense creates the session's most meaningful mechanical support. |
| 🔴 OI-R: OI-R at **58,000** in a gap-down scenario is the distant overhead ceiling and the maximum recovery target for bulls — it is 313+ points above the gap-down open level, making it effectively unreachable on an average intraday session unless the gap-down reverses completely; however, OI-R 58,000's significance is that CE writers at this strike are now deeply out-of-the-money and will not be delta-selling into any rally below 57,800–57,900, removing one layer of selling pressure from the mid-range and potentially allowing recovery attempts to reach TC 57,771.80 and H3 57,821.18 more easily. The practical implication is that in a gap-down session, OI-R 58,000 functions as the 'no-man's land' ceiling — any intraday short that is covered near 57,800 should NOT target 58,000 as the upside risk, because reaching 58,000 from a gap-down open would require a 300+ point reversal that is statistically improbable without a major fundamental catalyst. | 🟢 OI-S: OI-S at **57,000** is the primary bear destination and the monthly PE max OI wall that defines the session's maximum risk for longs — in a gap-down scenario where the Descending CPR structure is confirmed, OI-S 57,000 is approximately 540–687 points below the prior close (depending on gap magnitude), making it a realistic end-of-day target for sustained selling that begins at the open. The PE writer dynamic at OI-S 57,000 creates the most important intraday floor of the entire August 2026 expiry cycle — PE writers who sold 57,000 puts will begin significant delta-buying (buying futures) as price approaches 57,000, creating a mechanical support that can trigger a 200–300 point relief bounce; traders should book short profits aggressively near 57,050–57,100 rather than waiting for OI-S 57,000 to be exactly hit, as the mechanical buying tends to anticipate rather than react to the strike level. |
⚡ Key Trigger: The primary bear trigger in a gap-down scenario is **confirmed failure to reclaim BC 57,715.24 within the first 15 minutes** — the Descending CPR structure means that BC 57,715.24 is already the 'lower edge of a bearish CPR', and failure to reclaim it confirms multi-session bearish continuation with L3 57,552.72 and PDL 57,527.75 as immediate targets; the bull recovery trigger is a **first 15-minute candle close above BC 57,715.24 followed by a hold above P 57,743.52** within the next 15-minute candle, which would signal that the gap-down was a fake-out and gap-fill toward TC 57,771.80 and H3 57,821.18 is underway. The significance of BC 57,715.24 as the trigger is amplified by the Narrow CPR width — at only 56.56 points wide, reclaiming BC and then TC in a single trending move is feasible within 30 minutes, and momentum algos watching this Descending CPR breakpoint will pile in once BC is cleared.
◆ Near Flat Open — Open ≈ Prev Close (±0.05%)
▼ Bearish
Open lands: A flat open within ±0.05% of prev close 57,686.95 places the open in the 57,658–57,716 range — per the Descending CPR framework, a flat open is described as 'near prev close → at or near TC, where CPR acts as resistance below'; in practice, this places the flat open either just below BC 57,715.24 (if near the lower end of the flat range) or fractionally inside the lower CPR band (if near the upper end), creating an immediate decision zone where price is probing the lower boundary of the Descending CPR band.
CPR role: In a Descending-Narrow CPR flat-open scenario, the CPR band (BC 57,715.24–TC 57,771.80) acts as an overhead resistance zone that sits barely above the flat open price — the Descending CPR structure says that the CPR band is bearish context, meaning the default expectation is that price will fail to enter and hold the CPR band; however, a sustained first 15-minute close inside or above TC 57,771.80 would be a genuine trend-reversal signal, while a flat open that then sells off from BC 57,715.24 confirms the Descending CPR's bearish bias in the most decisive way.
Near Flat (±0.05%)
A flat open in BANKNIFTY's Descending-Narrow CPR environment (0.10% wide) creates the classic 'Descending CPR flat open' scenario where price hovers near the lower CPR boundary (BC 57,715.24) and the structural bias is bearish — the CPR band is the 'enemy territory' for bulls, sitting above the open as resistance, and the first 15-minute candle will determine whether bears press the advantage immediately or bulls make a brief incursion into the CPR band. The critical level for this scenario is BC 57,715.24 — a flat open that is unable to ENTER the CPR band (i.e., cannot achieve a 15-minute close above BC 57,715.24) is an immediate bearish confirmation that the Descending CPR is intact, and the first target is L3 57,552.72 followed by PDL 57,527.75; conversely, a first 15-minute close above BC 57,715.24 is a bullish surprise that challenges the Descending structure. The Narrow CPR width of 0.10% (56.56 points) means the CPR band can be transited quickly in either direction — a trending bull day requires clearing TC 57,771.80 within 30 minutes, at which point the Descending CPR's bearish narrative is suspended and H3 57,821.18 becomes the next target; the trending bear day (statistically higher probability given Descending type) requires confirming below BC 57,715.24 within the first 15 minutes, after which L3 57,552.72, L4 57,418.49, and OI-S 57,000 become the cascading targets. Both the bull trigger (close above TC 57,771.80) and bear trigger (close below BC 57,715.24) should be acted upon promptly given the Narrow CPR and Trending market structure — 'wait and see' is NOT a valid strategy in this setup, as narrow CPR trending days tend to develop momentum early and sustain it for 3–4 hours before finding a reversal.
|
▲ Upside Path → OI-R The bull recovery path from a flat open reads **TC 57,771.80 → H3 57,821.18 → H4 57,955.40 → R1 57,959.29 → OI-R 58,000 → PDH 58,015.85**, with TC 57,771.80 as the structural breakout confirmation, H3 57,821.18 as the Camarilla first target (first partial profit per Narrow rule), and H4 57,955.40 and R1 57,959.29 as the convergent second-resistance zone where the second partial should be booked and trailing stops tightened significantly. The monthly max pain and OI-R at 58,000 is the ultimate bull target for the flat-open scenario — reaching 58,000 from a flat open near 57,686 represents approximately 313 points of upside, which is the maximum realistic daily move in a non-trend-acceleration session and requires sustained institutional buying throughout the first half of the session to achieve. |
▼ Downside Path → OI-S The bear path from a flat open reads **BC 57,715.24 → L3 57,552.72 → PDL 57,527.75 → L4 57,418.49 → S1 57,471.19 → OI-S 57,000**, with BC 57,715.24 as the breakdown trigger, L3 57,552.72 as the first Camarilla bear target (Narrow rule: partial at first level), and the PDL 57,527.75 and L4/S1 cluster at 57,418.49–57,471.19 as the second major support zone where partial profits should be locked and trailing stops moved to breakeven or better. OI-S 57,000 is the anchor destination that defines the full bearish trending day in BANKNIFTY — approximately 715 points from the flat open, this target is achievable in an aggressive trending session but requires L4 57,418.49 and L5 57,261.71 to be broken sequentially, with each break accelerating the move as retail stop-losses and institutional delta-hedging combine to create a waterfall effect toward the monthly PE max OI floor. |
| 🔴 OI-R: OI-R at **58,000** in a flat-open Descending CPR scenario is the maximum upside ceiling and monthly max pain level — CE writers at 58,000 represent the largest concentration of short-gamma positions in BANKNIFTY for August 2026, and their delta-selling into every rally toward 58,000 creates a formidable supply wall that makes sustained trading above 58,000 improbable without a major catalyst; in the flat-open context where price is 313 points below OI-R, this level serves as the 'north star' for the bull case — it is the destination that confirms a complete bull day, but the probability of reaching it from a flat open given the Descending CPR structure is low (perhaps 15–20% for the session). The tactical significance of OI-R 58,000 is primarily as an exit point for any longs that manage to develop through the H4 57,955.40 zone — traders long from CPR breakout should exit the majority of their position between H4 57,955.40 and OI-R 58,000, not beyond, given CE writer supply in this zone. | 🟢 OI-S: OI-S at **57,000** in a flat-open Descending CPR scenario is the primary bear destination and the structural anchor for the entire BANKNIFTY August 2026 expiry — PE writers at 57,000 represent massive open interest that creates mechanical futures-buying support as price approaches this level, and the monthly expiry cycle still has significant time premium (expiry 25 Aug 2026 is 14 days away), meaning PE writers are not yet in panic mode even if price approaches 57,000. The flat-open bear trigger at BC 57,715.24 targets OI-S 57,000 as the session's ultimate destination: the path from BC 57,715.24 to OI-S 57,000 covers 715.24 points, which is within the monthly straddle's expected range of ±607 points — just beyond the standard deviation but achievable on a high-momentum day; traders should monitor volume carefully on this path, as a below-average volume decline that reaches 57,200–57,300 (L5 57,261.71) on low volume is more likely to reverse than a high-volume waterfall that tests OI-S 57,000 directly. |
⚡ Key Trigger: The dual trigger for the BANKNIFTY flat-open scenario is: **Bear — first 15-minute candle close below BC 57,715.24** confirms Descending CPR bearish structure with full conviction, activating L3 57,552.72 as the first target; **Bull — first 15-minute candle close above TC 57,771.80** challenges the Descending CPR and activates H3 57,821.18 as the first bull target. BC 57,715.24 is the more important of the two triggers because the Descending CPR framework assigns bearish default — the bull scenario requires OVERRIDING the structural bias, while the bear scenario is simply CONFIRMING it, making the probability-weighted trade heavily toward the bear trigger materialising first in a flat-open session; the narrow 56.56-point CPR band means that once BC is broken, the gap to L3 57,552.72 (162.52 points) is clear and unobstructed by any significant level, creating a fast and clean first leg down.
SENSEX
Overlapping — Narrow (Width 0.05%)
◆ Neutral
Market Structure Trending (up or down trend) | Straddle Weekly ATM 78500 straddle priced at **807.0 points** (Call 477.15 + Put 329.85), implying an expected weekly move of approximately ±403 points from 78,500, defining the week's range as roughly 78,097–78,903; the monthly straddle at 1,643.1 points implies a broader range of 76,857–80,143, and the significant asymmetry between Call 477.15 and Put 329.85 in the weekly straddle suggests options markets are pricing greater upside risk than downside risk for this week, a subtle bullish lean from implied volatility skew. | Max Pain Weekly max pain at **78,600** is only 57.56 points above Friday's close of 78,542.44, making it the closest max pain proximity of the three indices — this creates extremely strong gravitational pull toward 78,600 for the week's expiry (13 Aug 2026), and Monday's session will be heavily influenced by this proximity; monthly max pain also at **78,600** amplifies this effect, with both expiries aligned at the same strike creating an unusually powerful magnet that option sellers will defend aggressively through the mid-week. |
Tomorrow's Complete Level Map
OI-R: 80,000 R3: 79,091.36 H6: 78,921.68 H5: 78,871.80 R2: 78,884.17 H4 ▶: 78,750.37 R1: 78,713.30 PDH: 78,676.98 H3 ↩: 78,646.41
TC: 78,524.27 P: 78,506.11 BC: 78,487.95
L3 ↩: 78,438.47 PDL: 78,298.92 S1: 78,335.24 L4 ▶: 78,334.51 S2: 78,128.05 L5: 78,213.08 L6: 78,163.20 S3: 77,957.18 OI-S: 76,000
↩ = Camarilla reversal point | ▶ = Camarilla breakout/breakdown trigger | OI-R/OI-S = Options wall (CE/PE max OI)
▲ Higher Open (Gap Up) — Open > Prev Close
▲ Bullish
Open lands: SENSEX's Overlapping-Narrow CPR (BC 78,487.95–TC 78,524.27) partially overlaps with Friday's close of 78,542.44 — since prev close 78,542.44 is fractionally ABOVE TC 78,524.27 (by 18.17 points), a gap-up open above prev close moves price further above TC 78,524.27, landing in the 78,543–78,746 range (minor to significant gap), well above the entire CPR band; the open is in the zone between TC 78,524.27 and H3 78,646.41, placing the CPR band below as structural support from the first tick.
CPR role: In an Overlapping-Narrow CPR gap-up scenario where prev close was already above TC 78,524.27, the CPR band (BC 78,487.95–TC 78,524.27) acts as a launch pad and immediate intraday support — since price was above TC at Friday's close and now gaps up further, the bullish structure is reinforced; any pullback to TC 78,524.27 in a gap-up session should be treated as a long opportunity (buy the dip to TC) rather than a signal of failure, while only a breach below BC 78,487.95 changes the intraday structure to neutral-to-bearish.
Minor Gap (0.05–0.25%) — Structure Dominant
A minor gap-up of 0.05%–0.25% places the SENSEX open in the 78,543–78,739 range, which sits between TC 78,524.27 and H3 78,646.41 — for the lower end of this range (78,543–78,600), price is between TC and max pain 78,600 (weekly), creating a scenario where the first 15 minutes will be dominated by the gravitational pull of the 78,600 max pain level. The Overlapping-Narrow CPR with a gap-up scenario means the CPR band below is acting as a 'one-way ratchet' — as long as TC 78,524.27 holds on any intraday pullback, the session bias remains bullish and the path toward max pain 78,600, H3 78,646.41, and PDH 78,676.98 is the dominant trade. The first 15-minute close above max pain 78,600 (which also coincides with weekly max pain AND monthly max pain) is the key trigger for the session: a hold above 78,600 on the first 15-minute candle targets H3 78,646.41 and PDH 78,676.98 as the first partial zone, with R1 78,713.30 and H4 78,750.37 as the secondary targets per the Narrow CPR confirmation rule.
Significant Gap (0.25–0.5%) — Balanced
A significant gap-up of 0.25%–0.50% pushes the SENSEX open to approximately 78,739–78,934, placing price between H3 78,646.41 and H5 78,871.80 — opening above H3 78,646.41 means the Camarilla mean-reversion first resistance has been breached at the open, and price is already in the Camarilla extension zone. Gap-fill risk is elevated because the CPR band (BC 78,487.95–TC 78,524.27) is 250–400 points below the significant gap-up open, making any mean-reversion move toward the CPR band a very large intraday retracement; delta-hedging flows from CE writers at OI-R 80,000 — which is still approximately 1,100+ points above — will NOT be a factor at these price levels, meaning the supply dynamics are entirely driven by profit-takers from the prior session and short-term momentum sellers fading the Camarilla extension. The primary tactical question in a significant gap-up is whether H4 78,750.37 acts as resistance (fade target toward 78,646) or support (momentum entry above H4 targeting R1 78,713.30, H5 78,871.80, and R2 78,884.17).
Large Gap (>0.5%) — Gap Direction Dominant
A large gap-up exceeding 0.50% carries SENSEX above 78,934, opening into the H5 78,871.80–H6 78,921.68 Camarilla upper extension zone or beyond — this is extreme Camarilla territory for SENSEX where the probability of gap-fill within the session is historically high, especially given that OI-R is at the distant 80,000 level and the weekly straddle prices only 807 total points. Opening above H5 78,871.80 means the weekly straddle's upper boundary (approximately 78,903) has been breached at the open, suggesting a significant overnight catalyst has driven the move; in this scenario, the primary strategy is mean-reversion selling from H5–H6 zone targeting PDH 78,676.98 and TC 78,524.27, with the abort level for mean-reversion shorts being a 15-minute close above H6 78,921.68 that would signal a genuine momentum breakout targeting weekly CPR resistance at TC 78,677.51 and beyond.
|
▲ Upside Path → OI-R The bull continuation path from a confirmed gap-up reads **H3 78,646.41 → PDH 78,676.98 → R1 78,713.30 → H4 78,750.37 → H5 78,871.80 → R2 78,884.17**, with H3 78,646.41 as the first Camarilla target for partial profit (Narrow rule: 15-minute close confirmation), PDH 78,676.98 as the prior day's high where stop-run buying may create a brief spike, and R1 78,713.30 as the first Traditional target where the first partial profit must be booked definitively per the Narrow CPR rule. Above R1 78,713.30, the H4 78,750.37 breakout trigger opens the path toward H5 78,871.80 and R2 78,884.17 — a zone approximately 330–360 points above R1 that represents the upper Camarilla extension and second Traditional target, beyond which OI-R 80,000 is extremely distant and should not be used as a near-term target in a normal session. |
▼ Downside Path → OI-S A failure in the gap-up scenario pulls price back through the Overlapping CPR band: **TC 78,524.27 → P 78,506.11 → BC 78,487.95 → L3 78,438.47 → L4 78,334.51 → S1 78,335.24**, with TC 78,524.27 as the primary failure signal (first 15-minute close below TC = gap-up trap), P 78,506.11 as the pivot mid-point where a brief bounce attempt is common, and BC 78,487.95 as the final CPR support — breach of BC 78,487.95 confirms full gap-up failure and targets L3 78,438.47 as the Camarilla bear target. Below L3 78,438.47, the L4 78,334.51 and S1 78,335.24 cluster (within 0.01 points of each other) forms a strong structural support zone approximately 150 points below BC 78,487.95, and OI-S at 76,000 — while the ultimate floor — is too distant (approximately 2,500 points) to be a realistic intraday target from a gap-up failure scenario. |
| 🔴 OI-R: OI-R at **80,000** in a SENSEX gap-up scenario is an extremely distant ceiling — approximately 1,450–1,700 points above normal gap-up open levels — and should be treated as the absolute boundary of the monthly expiry range rather than an active intraday target; CE writers at 80,000 are deeply out-of-the-money and will not generate any meaningful delta-selling pressure at current price levels, meaning the gap-up session's supply comes entirely from profit-takers, mean-reversion sellers at Camarilla extensions (H5/H6), and technical resistance at PDH 78,676.98. The practical significance of OI-R 80,000 for gap-up SENSEX is that its extreme distance creates a 'free air' scenario between R1 78,713.30 and OI-R 80,000 — there is no OI wall to constrain the bull move until 80,000, and the primary resistances are purely technical (H4 78,750.37, H5 78,871.80, R2 78,884.17), making this one of the more liquid and technically clean bull setups when the CPR structure aligns. | 🟢 OI-S: OI-S at **76,000** in a SENSEX gap-up scenario is irrelevant for intraday trading purposes — it is approximately 2,500 points below the current price, well outside any realistic intraday range defined by the 807-point weekly straddle, and serves only as the catastrophic multi-session bear target; its significance in this scenario is purely contextual — the massive distance between current price (78,542) and OI-S (76,000) confirms that PE writers are not under any pressure, they are not delta-hedging, and there is no mechanical PUT-side buying support near current levels. The implication for gap-up traders is that the downside floor on any intraday pullback is NOT the OI-S 76,000 level but rather the technical supports (BC 78,487.95, L3 78,438.47, PDL 78,298.92), and position sizing should be calibrated to these nearby levels rather than the distant OI-S floor. |
⚡ Key Trigger: The key trigger in a SENSEX gap-up scenario is **first 15-minute candle close above the dual max pain level at 78,600** — both weekly and monthly max pain aligning at 78,600 makes this the single most powerful gravitational level in the session, and a sustained 15-minute close above 78,600 signals that option sellers have lost the ability to pin price, triggering delta-hedging buying cascades that target H3 78,646.41, PDH 78,676.98, and R1 78,713.30. The failure scenario is a 15-minute close back below TC 78,524.27 after a gap-up open above this level — this signals that the gap-up was exhausted at the max pain zone (78,600) and the pullback toward P 78,506.11, BC 78,487.95, and L3 78,438.47 is the high-probability trade for the first 60–90 minutes of the session.
▼ Lower Open (Gap Down) — Open < Prev Close
▼ Bearish
Open lands: SENSEX prev close 78,542.44 is fractionally above TC 78,524.27 (by 18.17 points) — a gap-down open below prev close 78,542.44 can land in three distinct zones: (1) minor gap-down (0.05%–0.25%) places the open in the 78,346–78,542 range, potentially inside the Overlapping CPR band (78,487.95–78,524.27) or just below BC 78,487.95; (2) significant gap-down places the open below BC 78,487.95 and toward L3 78,438.47; (3) large gap-down places the open below PDL 78,298.92 — in all cases, the CPR band above acts as resistance.
CPR role: In an Overlapping-Narrow CPR gap-down scenario, the CPR band (BC 78,487.95–TC 78,524.27) acts as overhead resistance above the gap-down open — the degree of overlap with Friday's prior range (Overlapping CPR type) means the CPR band inherits some of Friday's price memory, creating a scenario where recovery attempts will face significant supply between BC 78,487.95 and TC 78,524.27; the 36.32-point CPR band is narrow enough to be transited quickly if bulls are in control, but in a gap-down scenario with Overlapping structure, the default expectation is that the CPR band acts as a ceiling until a 15-minute close above TC 78,524.27 forces a reconsideration.
Minor Gap (0.05–0.25%) — Structure Dominant
A minor gap-down of 0.05%–0.25% places the SENSEX open in the 78,346–78,542 range — the upper end of this range (78,500–78,542) lands price inside the Overlapping CPR band itself (between BC 78,487.95 and TC 78,524.27), creating a scenario where price opens in the decision zone rather than below it, and the first 15-minute candle determines directional control with immediate clarity. If the open is inside the CPR band (78,487.95–78,524.27), the intraday structure is perfectly balanced — bulls want a close above TC 78,524.27 to confirm max pain 78,600 as the day's target, while bears want a close below BC 78,487.95 to confirm L3 78,438.47 as the bear target; the dual max pain alignment at 78,600 (weekly AND monthly) creates strong gravitational support for a recovery from a minor gap-down, as option sellers are heavily incentivised to buy futures near current levels. If the open is below BC 78,487.95 (lower end of minor gap range, 78,346–78,487), the bear thesis has more conviction — BC 78,487.95 becomes overhead resistance and L3 78,438.47, PDL 78,298.92, and L4 78,334.51 are the sequential bear targets for the morning session.
Significant Gap (0.25–0.5%) — Balanced
A significant gap-down of 0.25%–0.50% drops the SENSEX open to approximately 78,150–78,346, placing price below the entire CPR band, below L3 78,438.47, and approaching or through L4 78,334.51 and S1 78,335.24 — this level cluster (within 1 point of each other at 78,334.51–78,335.24) is the most important structural support in the entire downside framework, and opening at or near this zone creates a potential 'knife-catch' scenario for institutional buyers. Recovery probability is moderate in a significant gap-down because the dual max pain at 78,600 (only 254–450 points above) creates powerful incentive for option sellers to buy futures and push price back toward 78,600 by end-of-week; however, the Overlapping CPR band (78,487.95–78,524.27) sits in the middle of the recovery path as resistance, meaning recovery requires two significant structural hurdles (L4/S1 at 78,334.51–78,335.24 base, then CPR band reclaim) before max pain gravity kicks in fully. The failure-and-resume bear scenario from a significant gap-down targets L5 78,213.08, S2 78,128.05, and L6 78,163.20 as sequential intraday supports below L4 78,334.51.
Large Gap (>0.5%) — Gap Direction Dominant
A large gap-down exceeding 0.50% carries SENSEX below 78,150, placing price below L5 78,213.08 and approaching S2 78,128.05 — this is a structurally significant breach that breaks below the monthly CPR band (BC 77,069.67–TC 77,752.99 for the month, though these are month-level levels) and enters the 'panic zone' for the weekly expiry where the 807-point weekly straddle is being rapidly consumed on the downside. The VIX absence is particularly notable in a large gap-down SENSEX scenario — without VIX context, traders cannot determine whether this is a fear spike (high VIX = reversion candidate) or a structured decline (moderate VIX = trend continuation), so straddle pricing becomes the primary risk gauge; at 807 weekly straddle points, a large gap-down of 0.50%+ consumes approximately 50% of the week's expected range, suggesting the market has not priced in this gap, and professional straddle monetisation (selling puts or buying futures) becomes the dominant institutional activity near L5 78,213.08 and S2 78,128.05. The recovery scenario requires reclaiming L4 78,334.51 on a 30-minute close, then BC 78,487.95 on a subsequent 30-minute close — until both are achieved, the bear thesis is in control and shorts should trail stops through L5 78,213.08, L6 78,163.20, and S2 78,128.05 toward the extreme scenario of S3 77,957.18.
|
▲ Upside Path → OI-R The recovery path from a gap-down reads **BC 78,487.95 → P 78,506.11 → TC 78,524.27 → max pain 78,600 → H3 78,646.41 → PDH 78,676.98**, with BC 78,487.95 as the first recovery confirmation signal (first 15-minute close above BC initiates gap-fill), P 78,506.11 as the CPR pivot mid-point, TC 78,524.27 as the full CPR reclaim trigger, and max pain 78,600 as the primary session target given the weekly/monthly alignment. Above max pain 78,600, H3 78,646.41 is the Camarilla first target for partial profits, and PDH 78,676.98 is the natural stop-run target that typically caps the recovery move before R1 78,713.30 comes into play for afternoon trading. |
▼ Downside Path → OI-S The bear continuation path reads **L3 78,438.47 → PDL 78,298.92 → L4 78,334.51 → S1 78,335.24 → L5 78,213.08 → S2 78,128.05 → L6 78,163.20**, with L3 78,438.47 as the first Camarilla bear target (first partial profit per Narrow rule), the PDL 78,298.92 and L4/S1 cluster at 78,334.51–78,335.24 forming the most critical structural support band in the downside framework where institutional buyers are likely positioned. Below PDL 78,298.92, the L5 78,213.08–L6 78,163.20–S2 78,128.05 cluster represents the lower Camarilla extension zone and second Traditional support where the bear move should pause significantly — retail stops below PDL 78,298.92 will accelerate the initial decline toward L4/S1 78,334.51–78,335.24, but the confluence of four levels within a 200-point range (78,128–78,335) should create meaningful buying interest and slow the decline materially. |
| 🔴 OI-R: OI-R at **80,000** in a SENSEX gap-down scenario is a completely irrelevant intraday reference — at 1,450+ points above the gap-down open price, CE writers at 80,000 have zero delta-hedging activity near current levels and contribute no meaningful supply pressure; the practical implication is that the gap-down session operates with NO ceiling from OI dynamics for the first 1,400+ points of any recovery, meaning the upside is technically constrained only by Camarilla and Traditional levels (H3, H4, H5, R1, R2) and NOT by the options market's OI wall. This 'free air' between current levels and OI-R 80,000 actually creates a slightly bullish undercurrent in gap-down recoveries — absence of CE writer supply means recoveries can accelerate faster than in NIFTY (where OI-R 24,600 is only 50–100 points above), and traders should not pre-emptively cap their recovery targets at nearby resistance just because OI-R seems distant. | 🟢 OI-S: OI-S at **76,000** in a SENSEX gap-down scenario is the weekly PE max OI anchor for the longer term but is approximately 2,500 points below the gap-down open — even in a large gap-down scenario, OI-S 76,000 is completely unreachable on a single intraday session; however, its significance is that it defines the OUTER BOUNDARY of rational selling by hedgers: institutions who bought 76,000 puts as tail-risk hedges will NOT be selling futures at current levels (78,000+), meaning there is no mechanical PUT delta-selling pressure anywhere near the current price. The practical implication for gap-down traders is that the downside supports (L3 78,438.47, L4 78,334.51, L5 78,213.08, S2 78,128.05) are NOT reinforced by PE writer buying from OI-S 76,000 — they are purely technical levels, and breaks below them will rely solely on technical structure and intraday momentum rather than the mechanical support floor that OI-S proximity provides in indices like NIFTY (where OI-S is 500 points from current price). |
⚡ Key Trigger: The primary trigger in a SENSEX gap-down scenario is **failure to reclaim BC 78,487.95 within the first 15 minutes**, which confirms the CPR band as overhead resistance and activates the bearish continuation toward L3 78,438.47 and L4/S1 78,334.51–78,335.24; the bull recovery trigger is a **first 15-minute candle close above TC 78,524.27**, which fully reclaims the Overlapping CPR band and initiates the max pain gravity trade toward 78,600 and then H3 78,646.41. The dual max pain alignment at 78,600 for both weekly (13 Aug) and monthly (27 Aug) expiries makes this the most important gravitational force in SENSEX for the entire week — any gap-down that is reclaimed with a close above TC 78,524.27 and then above 78,600 should be expected to magnetize price toward 78,600 through the remainder of the week, making the morning recovery signal (TC reclaim) the highest-reward setup for Tuesday through Thursday if Monday's session confirms it.
◆ Near Flat Open — Open ≈ Prev Close (±0.05%)
◆ Neutral
Open lands: A flat open within ±0.05% of prev close 78,542.44 places the SENSEX open in the 78,503–78,581 range — since TC 78,524.27 is 18.17 points below prev close 78,542.44, a flat open will land either fractionally above TC 78,524.27 (if in the 78,524–78,581 range) or marginally inside the CPR band (if in the 78,503–78,524 range); this is the 'Overlapping CPR' characteristic — the flat open is effectively at the top of or just above the CPR band, making the CPR band a decision zone directly below the opening price.
CPR role: In an Overlapping-Narrow CPR flat-open scenario, the CPR band (BC 78,487.95–TC 78,524.27) acts as an immediate decision zone and compression band directly below the open — the Overlapping CPR type means the prior session's price activity has partially 'consumed' the CPR band's information value, and Monday's first 15-minute candle will establish whether the bullish close above TC holds (launching toward max pain 78,600) or whether Friday's bullish close was a false signal (pulling back into and below BC 78,487.95). The proximity of the flat open to TC 78,524.27 (within 18 points in the bullish direction) means the 'hold above TC' confirmation requires minimal additional price action from the open, making the bull trigger easier to confirm than in most sessions.
Near Flat (±0.05%)
A flat open in SENSEX's Overlapping-Narrow CPR environment creates the purest decision-zone scenario — price opens at the top of the CPR band (near TC 78,524.27 or just above), and the market must immediately reveal its directional intent through the first 15-minute candle without the additional context of a gap providing momentum bias. The key structural insight is that prev close 78,542.44 was already above TC 78,524.27, meaning Friday closed with the market above its own day's CPR band — a bullish signal that the Trending (up or down) market structure has taken a bullish direction; a flat open that HOLDS above TC 78,524.27 for the first 15 minutes confirms this bullish continuation and targets max pain 78,600 (weekly + monthly, dual alignment), H3 78,646.41, and PDH 78,676.98 as the session's primary objectives, while a first 15-minute close below BC 78,487.95 challenges Friday's bull close and activates the bear structure toward L3 78,438.47 and L4/S1 78,334.51–78,335.24. The Narrow CPR width of 0.05% (36.32 points) in combination with the Trending market structure creates a very high probability of a trending day in one direction — either a bull trend that starts above TC 78,524.27 and runs toward 78,676.98–78,713.30, or a bear trend that breaks BC 78,487.95 and runs toward 78,438.47–78,298.92; the 'middle ground' fade-and-return scenario is the lowest-probability outcome in a Narrow-Trending environment. Both the bull trigger (**first 15-minute close above TC 78,524.27 → confirm hold above 78,524.27 for the next 15 minutes**) and the bear trigger (**first 15-minute close below BC 78,487.95**) should be respected immediately — the dual max pain alignment at 78,600 adds a powerful additional dimension to the bull case that makes the bull trigger statistically more probable, but no confirmation should be assumed without the actual 15-minute close data.
|
▲ Upside Path → OI-R The bull path from a flat open reads **TC 78,524.27 → max pain 78,600 → H3 78,646.41 → PDH 78,676.98 → R1 78,713.30 → H4 78,750.37**, with TC 78,524.27 as the launch pad confirmation, max pain 78,600 as the dual-expiry magnetic target where the first partial profit should be taken (as CE writers defending 78,600 will create supply), H3 78,646.41 as the Camarilla first target for the second partial (Narrow rule: trail to Camarilla zone after first Traditional target), and PDH 78,676.98 as the natural stop-run target. Above PDH 78,676.98, R1 78,713.30 is the first Traditional target where the remaining position should be reduced significantly, and H4 78,750.37 is the Camarilla breakout trigger — a 15-minute close above H4 78,750.37 opens the path toward H5 78,871.80 and R2 78,884.17 in the afternoon session for the most aggressive bulls. |
▼ Downside Path → OI-S The bear path from a flat open reads **BC 78,487.95 → L3 78,438.47 → PDL 78,298.92 → L4 78,334.51 → S1 78,335.24 → L5 78,213.08**, with BC 78,487.95 as the breakdown confirmation trigger (first 15-minute close below BC = bear day confirmed), L3 78,438.47 as the first Camarilla bear target for partial profit (Narrow rule: book first partial at L3 on 15-minute close), and the PDL 78,298.92 and L4/S1 cluster at 78,334.51–78,335.24 as the primary session target for bears where the majority of profits should be locked. Below PDL 78,298.92 and L4/S1 78,334.51–78,335.24, the L5 78,213.08–S2 78,128.05–L6 78,163.20 zone is the Camarilla lower extension where the final portion of the short position should be covered — retail stop-losses just below BC 78,487.95 (approximately 78,475–78,480) will accelerate the initial decline toward L3 78,438.47 with unusual speed in the first 15–30 minutes of the bear scenario. |
| 🔴 OI-R: OI-R at **80,000** in SENSEX's flat-open scenario is an extremely distant ceiling — 1,457.56 points above Friday's close — and functions purely as the absolute monthly boundary ceiling rather than an active intraday reference; CE writers at 80,000 will have zero delta-hedging activity near 78,500, meaning Monday's flat-open session has no OI-R pressure acting as supply in the normal intraday range. The significance of OI-R 80,000's distance for the flat-open bull scenario is that the entire upside path from TC 78,524.27 to R2 78,884.17 and beyond has NO options-derived resistance until price approaches 80,000 — this means resistances at H3 78,646.41, PDH 78,676.98, R1 78,713.30, and H4 78,750.37 are purely technical and not reinforced by CE writer hedging, making breakout failures at these levels more likely to be temporary and continuation rallies more likely to extend further than in indices where OI-R is nearby. | 🟢 OI-S: OI-S at **76,000** in SENSEX's flat-open scenario provides no active mechanical support in the intraday range — at approximately 2,542 points below the flat open, it is the multi-month tail-risk anchor for PE hedgers rather than an intraday reference; the practical implication for flat-open traders is that the intraday downside floor is defined entirely by technical levels (L3 78,438.47, L4/S1 78,334.51–78,335.24, L5 78,213.08, S2 78,128.05) and NOT by mechanical PE writer buying from the OI-S 76,000 zone. This absence of near-term OI-S mechanical support means that on a true bear trending day in SENSEX, downside moves can run further and faster between technical levels than in NIFTY, and bears who correctly identify the BC 78,487.95 breakdown should trail stops aggressively through the L-series Camarilla levels rather than holding for a single large target — each level break accelerates the decline more than options mechanics would slow it, creating a cascading effect that favors incremental partial profit booking over holding for the full target. |
⚡ Key Trigger: The dual trigger for the SENSEX flat-open scenario is: **Bull — first 15-minute candle close AND hold above TC 78,524.27** (two-candle confirmation for Overlapping CPR type to reduce false breakouts) confirms bullish momentum toward max pain 78,600, H3 78,646.41, and PDH 78,676.98; **Bear — first 15-minute candle close below BC 78,487.95** confirms bearish reversal from Friday's close above TC, activating L3 78,438.47, PDL 78,298.92, and L4/S1 78,334.51–78,335.24 as sequential targets. TC 78,524.27 is the structural fulcrum of the session because it represents the exact boundary between 'Friday's bull close was confirmed' (above TC) and 'Friday's bull close was a false break' (below TC) — the dual max pain at 78,600 for both expiries creates an asymmetric probability weight toward the bull trigger materialising, but the Narrow CPR rule requires confirmation via the first 15-minute close rather than assumed direction, and traders who front-run this confirmation risk being trapped on the wrong side of the day's trend.
📊 VIX Insight: India VIX data is unavailable for 10 Aug 2026 (shown as '—'), which represents a significant information gap for Monday's session — without VIX, traders cannot determine whether the near-flat closes across NIFTY (+0.05%), BANKNIFTY (-0.10%), and SENSEX (+0.06%) reflect genuine low-volatility complacency or a calm before a volatility expansion event. In the absence of VIX, the proxy for expected daily range is the weekly straddle pricing: NIFTY's 147.9-point straddle implies a ±0.60% daily envelope, SENSEX's 807-point straddle implies ±1.03%, and BANKNIFTY's monthly 1,215.75-point straddle implies ±2.11% for the monthly cycle — traders should use these straddle-implied ranges as their volatility compass for Monday and should significantly reduce position size in the absence of confirmed VIX data, as gap scenarios that violate straddle boundaries (a large gap-up or gap-down exceeding the weekly straddle's full range in a single session) would indicate a high-VIX event that requires rapid re-calibration.
Overall View:
All three indices closed Friday within a whisker of their Day CPR bands — NIFTY's Outside-Narrow CPR at 24,566–24,578, BANKNIFTY's Descending-Narrow CPR at 57,715–57,772, and SENSEX's Overlapping-Narrow CPR at 78,488–78,524 — creating a Monday that is primed for a high-probability trending day in ONE direction, with the first 15-minute candle across all three charts expected to set the session's tone. The subtle divergence between NIFTY (neutral, Outside CPR) and BANKNIFTY (bearish, Descending CPR) is the most important cross-index signal: if BANKNIFTY breaks BC 57,715 to the downside while NIFTY holds above TC 24,578, the divergence will create sector rotation dynamics rather than a clean index trend; however, if both confirm the same directional bias in the first 15 minutes, a coordinated trending session is likely with NIFTY targeting 24,600–24,632 (bull) or 24,500 (bear), BANKNIFTY targeting 58,000 (bull) or 57,000 (bear), and SENSEX targeting 78,600 (bull, max pain gravity) or 78,335 (bear, L4/S1 cluster). Traders should wait for confirmed 15-minute closes above TC or below BC for each respective index before committing to directional positions — the Narrow CPR widths across all three indices (0.05%–0.10%) mean the triggers will materialise quickly, but acting before the candle closes risks being caught in the CPR band's indecision zone on what may be the most important directional day of the week.
All three indices closed Friday within a whisker of their Day CPR bands — NIFTY's Outside-Narrow CPR at 24,566–24,578, BANKNIFTY's Descending-Narrow CPR at 57,715–57,772, and SENSEX's Overlapping-Narrow CPR at 78,488–78,524 — creating a Monday that is primed for a high-probability trending day in ONE direction, with the first 15-minute candle across all three charts expected to set the session's tone. The subtle divergence between NIFTY (neutral, Outside CPR) and BANKNIFTY (bearish, Descending CPR) is the most important cross-index signal: if BANKNIFTY breaks BC 57,715 to the downside while NIFTY holds above TC 24,578, the divergence will create sector rotation dynamics rather than a clean index trend; however, if both confirm the same directional bias in the first 15 minutes, a coordinated trending session is likely with NIFTY targeting 24,600–24,632 (bull) or 24,500 (bear), BANKNIFTY targeting 58,000 (bull) or 57,000 (bear), and SENSEX targeting 78,600 (bull, max pain gravity) or 78,335 (bear, L4/S1 cluster). Traders should wait for confirmed 15-minute closes above TC or below BC for each respective index before committing to directional positions — the Narrow CPR widths across all three indices (0.05%–0.10%) mean the triggers will materialise quickly, but acting before the candle closes risks being caught in the CPR band's indecision zone on what may be the most important directional day of the week.
This analysis is for educational purposes only and is not investment advice.
Disclaimer: KRVFinMart provides educational and informational content relating to financial markets. Articles, research, examples, charts, strategies and tools are provided for educational purposes and should not be interpreted as personalised investment advice or a guarantee of financial performance. Markets involve risk, including possible loss of capital. Past performance does not guarantee future results. KRVFinMart is not a SEBI Registered Investment Adviser or Research Analyst.