
Index Research
Intraday Analysis for 12 Aug 2026
KRVFinMart11 August 202660 min
Educational/Derived AnalysisSource: KRVFinMart Research Desk (End-of-Day)As of 11 Aug 2026, 02:20 PM IST
Intraday Analysis for 12 Aug 2026
Indian equity indices closed in the red on 11 Aug 2026, with NIFTY settling at **24,471.70** (-0.46%), BANKNIFTY at **57,446.25** (-0.42%), and SENSEX at **78,154.25** (-0.49%), signalling broad-based selling pressure into the close. India VIX data is unavailable for this session, which limits precise implied-volatility context; however, given the synchronized decline across all three benchmark indices, traders should treat the opening with caution and wait for first 15-minute directional confirmation before committing size. All three indices are dealing with Descending Narrow or Medium CPR configurations for 12 Aug 2026, indicating that the CPR band sits below yesterday's close and will act as overhead resistance on any recovery attempt — a structure that inherently favors trend continuation to the downside unless a decisive reclaim occurs.
Key Market Signals — Intraday Setup
All three indices — NIFTY, BANKNIFTY, and SENSEX — closed below their respective 12 Aug 2026 Day CPR bands (NIFTY TC 24,503.05; BANKNIFTY TC 57,425.06; SENSEX TC 78,279.01), confirming that the CPR sits as overhead resistance heading into tomorrow's open. With synchronized negative closes and Descending CPR structures across the board, the path of least resistance remains downward unless a gap-up open reclaims TC on all three simultaneously.
Deep Technical Analysis & Levels
NIFTY
Descending — Narrow (Width 0.09%)
▼ Bearish
Market Structure Trending (up or down trend) | Straddle NIFTY Week ATM 24450 straddle is priced at **21.65 points** (Call 21.60 + Put 0.05), implying an extremely compressed expected move of roughly ±21 points for the expiry — this near-zero put premium signals the weekly expiry is in its terminal phase and directional bets via options are high-risk. The Month ATM 24450 straddle at **425.10 points** (Call 251.15 + Put 173.95) implies a broader ±425-point move to expiry on 25 Aug 2026, giving intraday traders a sense of the medium-term range the market is pricing in. | Max Pain NIFTY Week max pain is **24,450** (expiry 11 Aug 2026 — already expired or expiring today), and Month max pain is **24,500** (expiry 25 Aug 2026). The month max pain at 24,500 sits just above today's close of 24,471.70, suggesting option sellers have the most comfort with NIFTY hovering near 24,500 into expiry — any sustained move below 24,450 OI support or above 24,500 OI resistance would pressure option writers to hedge, adding momentum to whichever direction breaks out. |
Tomorrow's Complete Level Map
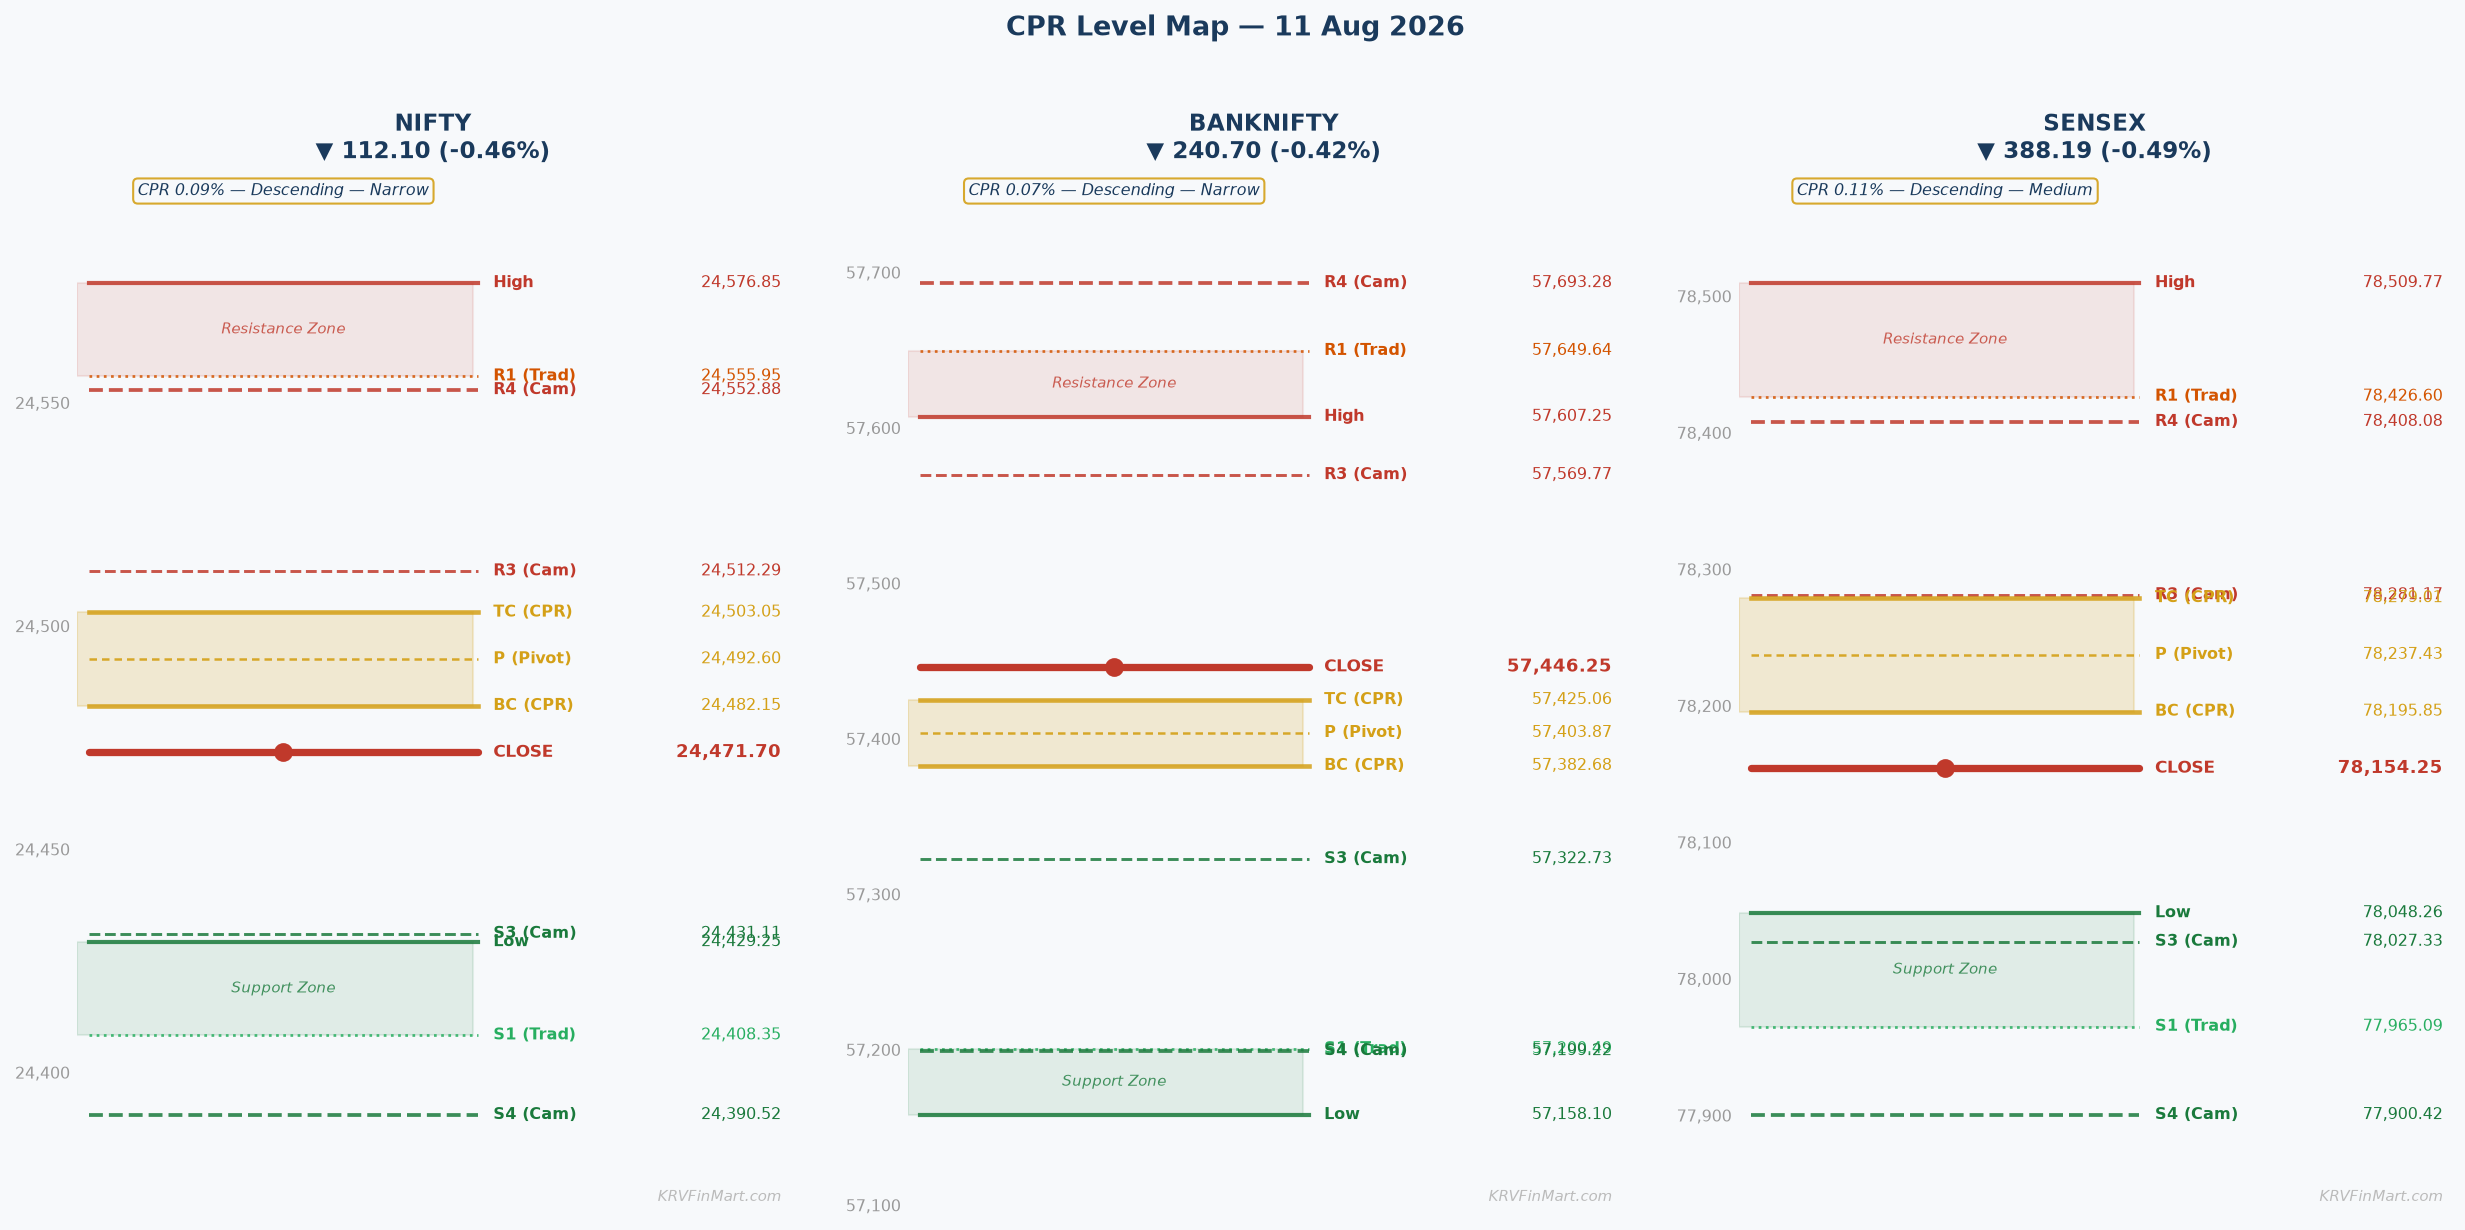
OI-R: 24,500 R3: 24,703.55 H6: 24,619.56 H5: 24,600.29 R2: 24,640.20 H4 ▶: 24,552.88 R1: 24,555.95 PDH: 24,576.85 H3 ↩: 24,512.29
TC: 24,503.05 P: 24,492.60 BC: 24,482.15
L3 ↩: 24,431.11 PDL: 24,429.25 S1: 24,408.35 L4 ▶: 24,390.52 S2: 24,345.00 L5: 24,343.11 L6: 24,323.84 S3: 24,260.75 OI-S: 24,450
↩ = Camarilla reversal point | ▶ = Camarilla breakout/breakdown trigger | OI-R/OI-S = Options wall (CE/PE max OI)
▲ Higher Open (Gap Up) — Open > Prev Close
▲ Bullish
Open lands: For a Descending CPR, a gap-up open means price opens above the entire CPR band (TC 24,503.05). Given prev close of 24,471.70, even a minor gap up of 0.05–0.10% lifts price to 24,484–24,495, placing it inside the CPR band (between BC 24,482.15 and TC 24,503.05). A significant gap of 0.25–0.5% opens price in the 24,532–24,593 zone, above TC 24,503.05 and into the H3 24,512.29 / R1 24,555.95 resistance cluster. A large gap above 0.5% would push the open above PDH 24,576.85.
CPR role: In a Descending CPR structure, a gap-up causes the CPR band (BC 24,482.15 to TC 24,503.05) to flip its role — it now acts as a launch pad if price holds above TC 24,503.05, or as a trap door if price gaps up into the band and then fails, pulling back below BC 24,482.15. The OI resistance at 24,500 sits almost exactly at the Pivot 24,492.60, making this the most critical overhead zone for gap-up scenarios.
Minor Gap (0.05–0.25%) — Structure Dominant
A minor gap up of 0.05–0.25% places the opening price between approximately 24,484 and 24,532 — landing inside the CPR band (BC 24,482.15 to TC 24,503.05) or just marginally above TC 24,503.05. The Descending Narrow CPR structure combined with this minor gap creates a conflicted opening: the CPR band offers a brief launch pad if TC 24,503.05 is reclaimed and held, but the OI resistance wall at 24,500 (CE max OI) sits directly inside this band and will immediately cap upside as call writers defend aggressively. For the Narrow CPR confirmation rule, traders need a first 15-minute candle close above TC 24,503.05 to validate any bullish intent — if confirmed, the first target is H3 24,512.29, followed by a partial exit at R1 24,555.95, with the Camarilla H4 24,552.88 acting as the breakout trigger for the next leg toward PDH 24,576.85.
Significant Gap (0.25–0.5%) — Balanced
A significant gap up of 0.25–0.5% opens NIFTY in the 24,532–24,593 range — above TC 24,503.05 and directly inside the H3 24,512.29 to R1 24,555.95 resistance cluster. At this opening level, price is already at the first Camarilla mean-reversion zone (H3 24,512.29), which acts as an initial stall or reversal reference; the Narrow CPR (0.09% width) signals a high-probability trending day, but the significant gap means gap-fill risk down to TC 24,503.05 and P 24,492.60 is elevated in the first 30 minutes. Delta-hedging flows from CE writers at the 24,500 OI resistance will create selling pressure immediately at the open — a failure to hold H3 24,512.29 on the first 15-minute close would indicate absorption by sellers and pivot the trade to short below P 24,492.60 targeting L3 24,431.11. If H3 24,512.29 holds and H4 24,552.88 is broken with conviction, the next targets are R1 24,555.95, PDH 24,576.85, and ultimately H5 24,600.29.
Large Gap (>0.5%) — Gap Direction Dominant
A large gap up exceeding 0.5% (above roughly 24,594) propels NIFTY above PDH 24,576.85 and into the H5 24,600.29 to H6 24,619.56 Camarilla zone at the open — a level where mean-reversion dynamics become dominant and gap-fill probability is very high given VIX data unavailability and the absence of a clear bullish overnight catalyst. The market psychology at this level is classic 'overnight squeeze': retail buyers chase the gap while institutional participants sell into the strength at H5 24,600.29 and H6 24,619.56, knowing that the monthly CPR Camarilla H3 24,637.86 is the next technical magnet above. The abort level for any long entered at the gap is a 15-minute close back below TC 24,503.05, and the straddle context (Month straddle 425.10 points) suggests the market has priced in up to 425 points of move to expiry — a 0.5%+ gap consumes a significant portion of that premium, making fresh long option positions costly and naked short strategies (selling OTM calls above 24,600) attractive for experienced traders.
|
▲ Upside Path → OI-R The confirmed upside path from TC 24,503.05 proceeds to **H3 24,512.29** (Camarilla mean-reversion zone, first partial exit), then to the dual resistance cluster of **H4 24,552.88 and R1 24,555.95** (Camarilla breakout trigger and Traditional first target — book 50% here), followed by **PDH 24,576.85** (previous day high, psychological resistance), and finally toward **H5 24,600.29** approaching the **OI-R ceiling at 24,500** — though note OI-R is actually at 24,500 below the opening level in gap-up scenarios, confirming that the OI wall has been breached and momentum is accelerating. Genuine momentum at each level is confirmed by volume expansion on each 15-minute candle — flat or declining volume at H3 24,512.29 on the first attempt signals a potential reversal zone. |
▼ Downside Path → OI-S Failure to sustain above TC 24,503.05 on the first 15-minute close converts the gap-up into a bull trap — price would retrace through Pivot **P 24,492.60** (first intraday pivot support), then BC **24,482.15** (bottom of CPR band, critical breakdown level), and accelerate toward **L3 24,431.11** (Camarilla mean-reversion zone, first downside target) which closely aligns with PDL **24,429.25** — a double technical floor. A break of L3 24,431.11 opens the path to **L4 24,390.52** and **S1 24,408.35**, with the ultimate target being **OI support at 24,450** where PE writers will attempt to defend. |
| 🔴 OI-R: The **OI resistance at 24,500** (CE max OI strike) sits inside the CPR band at the Pivot level 24,492.60 — in a gap-up scenario where price opens above 24,500, this OI wall has been overcome at the open but remains a critical intraday reference: if price pulls back to 24,500 and stalls, CE writers are re-establishing shorts and the level converts to resistance-turned-support only if held for 15 minutes. The gamma pressure dynamics at 24,500 are particularly intense given the Week max pain is also 24,450 — CE writers at 24,500 will aggressively sell any rally to 24,503–24,510, meaning the 24,500–24,503 zone acts as the key battleground between option sellers (supply) and momentum buyers (demand). | 🟢 OI-S: The **OI support at 24,450** (PE max OI strike) represents the primary downside floor built by put writers — in a gap-up scenario, this level is approximately 22 points below the close and functions as an abort level: if a gap-up fails and price slides all the way to 24,450, it signals total reversal of overnight bullishness and PE writers at this strike will face pressure to hedge (buy futures), which can briefly stabilize price. However, if the daily close is threatening to print below 24,450, put writers' protective buying (delta-hedging) can actually accelerate the downside as hedgers buy higher strikes and unwind lower PE positions simultaneously. |
⚡ Key Trigger: The key trigger for the gap-up scenario is a **first 15-minute candle close above TC 24,503.05** — this is the structural fulcrum because in a Descending Narrow CPR, TC represents the ceiling of the entire CPR band, and a confirmed close above it transforms the CPR from overhead resistance into a support launch pad, aligning price above all three CPR levels simultaneously. If the 15-minute candle closes below TC 24,503.05 (inside the band) or below BC 24,482.15 (below the entire band), the gap-up is classified as a failed breakout — control reverts to bears and the intraday bias flips bearish toward L3 24,431.11 and OI support 24,450.
▼ Lower Open (Gap Down) — Open < Prev Close
▼ Bearish
Open lands: For a Descending CPR, a gap-down open places price below the entire CPR band (BC 24,482.15). Given prev close of 24,471.70, a minor gap down of 0.05–0.25% opens NIFTY at roughly 24,447–24,459, which is just below OI support at 24,450 and near PDL 24,429.25. A significant gap of 0.25–0.5% opens in the 24,349–24,410 range, below L3 24,431.11 and S1 24,408.35. A large gap exceeding 0.5% opens below 24,349, potentially near L5 24,343.11 or S2 24,345.00.
CPR role: In a gap-down on a Descending Narrow CPR, the entire CPR band (BC 24,482.15 to TC 24,503.05) sits above the opening price and becomes overhead resistance — the CPR acts as a battleground zone that bears must defend and bulls must reclaim to change the intraday narrative. The OI support at 24,450 is now immediately tested at the open in a minor gap-down, while a significant or large gap bypasses this level entirely, converting it to overhead supply.
Minor Gap (0.05–0.25%) — Structure Dominant
A minor gap down of 0.05–0.25% opens NIFTY at approximately 24,447–24,459 — critically, this places the opening price directly at or just below the **OI support at 24,450** (PE max OI strike), which is the most crowded put-writing strike in the weekly expiry. Minor gaps inside the prior day's range have a gap-fill probability of 60–70% within the first 30–60 minutes, meaning a quick recovery attempt toward BC **24,482.15** is likely as put writers defend 24,450 by buying futures and short sellers take initial profits. However, the Narrow CPR (0.09% width) signals a trending day — if BC 24,482.15 acts as resistance on the gap-fill attempt and the first 15-minute candle closes back below 24,450, the trending day thesis kicks in bearishly and the next target is L3 **24,431.11** (Camarilla mean-reversion zone, closely aligned with PDL 24,429.25), followed by L4 **24,390.52** and S1 **24,408.35**.
Significant Gap (0.25–0.5%) — Balanced
A significant gap down of 0.25–0.5% opens NIFTY in the 24,349–24,410 range — this bypasses OI support 24,450 and PDL 24,429.25, opening below L3 **24,431.11** and potentially below S1 **24,408.35**, which represents a structurally bearish open where recovery requires reclaiming multiple levels simultaneously. The 30-minute reclaim rule applies: if price recovers back above L3 24,431.11 within the first 30 minutes and a 30-minute candle closes above BC 24,482.15, the bearish thesis is invalidated and the failure-and-resume pattern converts to a recovery play targeting P 24,492.60 then TC 24,503.05. The bear continuation path targets L4 **24,390.52**, then S2 **24,345.00** (closely aligned with L5 24,343.11), with PUT writing at 24,450 and 24,400 strikes being squeezed — the resulting delta-hedging (future buying by put writers) could create a bounce at L4 24,390.52 before the next leg down.
Large Gap (>0.5%) — Gap Direction Dominant
A large gap down exceeding 0.5% (below roughly 24,349) opens NIFTY near S2 **24,345.00** and L5 **24,343.11** — a zone that is 130+ points below yesterday's close, triggering panic-driven stop-losses and margin calls across retail long portfolios. With VIX data unavailable, it is impossible to precisely quantify implied-move expansion, but a large gap of this magnitude in the absence of a clear macro catalyst would typically see a sharp intraday V-reversal attempt as institutional participants and put writers deploy capital to defend the 24,300–24,350 zone. Straddle context (Month straddle 425.10 points) is key here — a 130-point gap consumes roughly 30% of the monthly premium already, making straddle sellers (who are short both sides) scramble to delta-hedge, which injects buying pressure at lows; the recovery level to watch is BC **24,482.15**, and the abort level for any recovery long is a 30-minute close below L5 **24,343.11**, which would open the path to L6 **24,323.84** and S3 **24,260.75**.
|
▲ Upside Path → OI-R The recovery path in a gap-down scenario begins with a hold or reclaim of **OI support 24,450** (critical PE base — put writers defend here with future buying), followed by a challenge of BC **24,482.15** (CPR floor, 30-minute close required to confirm reclaim), then Pivot **P 24,492.60**, TC **24,503.05**, and finally a test of OI resistance **24,500** — confirming genuine recovery requires each level to be reclaimed on a closing basis, not just on an intrabar spike. A dead-cat bounce is identified by a sharp 5-minute rally to BC 24,482.15 followed by a 15-minute candle that closes below P 24,492.60 — this pattern should be shorted rather than chased long. |
▼ Downside Path → OI-S The primary bear path from a gap-down open targets **L3 24,431.11** (Camarilla mean-reversion zone, closely aligned with PDL 24,429.25 — retail stop-losses cluster just below this confluence, accelerating the move once breached), then **L4 24,390.52** (Camarilla breakdown trigger — institutional shorts add here), followed by **S1 24,408.35** and ultimately the **OI support at 24,450** (which becomes a magnet for price as max pain gravity pulls toward 24,450–24,500 zone). A breach of L4 24,390.52 opens the path to L5 **24,343.11** and S2 **24,345.00**, where the monthly max pain at 24,500 ensures significant put writer stress at these levels. |
| 🔴 OI-R: The **OI resistance at 24,500** (CE max OI strike) acts as the primary short-side defense in a gap-down scenario — call writers at 24,500 are profitable and will sell any rally toward this level aggressively, making it the definitive overhead ceiling for any intraday recovery attempt. Gamma pressure at 24,500 intensifies as price approaches from below — every 10-point rally toward 24,500 forces CE writers to sell more futures to delta-hedge, creating a self-reinforcing ceiling that is very difficult to break through without a significant positive catalyst. | 🟢 OI-S: The **OI support at 24,450** (PE max OI strike) is the primary bear target and PUT monetisation zone — in a gap-down scenario, reaching 24,450 triggers active delta-hedging by put writers (buying futures to reduce delta exposure) which creates a natural stabilization point and the first profit-booking zone for intraday shorts. If 24,450 is breached convincingly (15-minute close below 24,450), it signals put writer capitulation and can trigger a cascade as the next large PE OI cluster at 24,000 (month OI support) becomes the gravitational target, though such an extreme move would require extraordinary selling pressure. |
⚡ Key Trigger: The key trigger for the gap-down scenario is the **failure to reclaim BC 24,482.15 within 30 minutes** — this is the structural fulcrum because BC represents the floor of the Descending CPR band; a reclaim of BC confirmed by a 30-minute close above it signals that the gap down was absorbed by buyers and the CPR band is now acting as support, shifting intraday bias back to neutral/bullish with the next target being TC 24,503.05 and OI resistance 24,500. Conversely, if BC 24,482.15 is tested on a recovery rally and the 30-minute candle closes below it, this confirms the CPR is acting as hard overhead resistance and the bear case is fully active — target L3 **24,431.11** immediately, then L4 **24,390.52**.
◆ Near Flat Open — Open ≈ Prev Close (±0.05%)
◆ Neutral
Open lands: A flat open of ±0.05% places NIFTY in the 24,459–24,484 range — a flat open at the lower end (24,459–24,471) sits below BC 24,482.15, inside the zone between OI support 24,450 and BC 24,482.15, making the CPR band entirely overhead resistance. A flat open at the higher end (24,471–24,484) sits just below BC 24,482.15, still below the entire Descending CPR — consistent with the Descending CPR rule where a flat open lands near TC (which here is 24,503.05, above the prev close), meaning the flat open is technically below BC 24,482.15 given prev close 24,471.70 is below BC.
CPR role: The CPR band (BC 24,482.15 to TC 24,503.05) acts as a **decision zone and compression band** — in a flat open on a Descending Narrow CPR, the band sits above price and the first 15-minute candle direction IS the trade. The narrow width of 0.09% means there is virtually no ambiguity: any sustained move above TC 24,503.05 is bullish, any rejection below BC 24,482.15 is bearish, and the distance between the two extremes (only ~21 points) makes the setup a high-reward, low-risk directional trade once the trigger fires.
Near Flat (±0.05%)
A flat open on NIFTY with a Descending Narrow CPR (0.09% width) is a **quintessential trend day setup** — the CPR band sits above yesterday's close (BC 24,482.15 to TC 24,503.05), meaning price opens below the entire CPR and the first 15-minute candle will definitively reveal which side of the band controls the session. The Narrow CPR width of 0.09% creates an extremely high-probability trending day (research consistently shows Narrow CPR days trend 70–75% of the time), and since the CPR is Descending, the structural bias is bearish — a flat open below BC 24,482.15 implies two consecutive sessions where price has been rejected from the CPR band. If price holds below BC **24,482.15** after the first 15 minutes, the Descending CPR acts as a ceiling and the bear thesis is confirmed: the OI support at 24,450 (PE max OI) is the first test, and a breach opens L3 **24,431.11**, L4 **24,390.52**, and S1 **24,408.35** in sequence. Conversely, a first 15-minute close above TC **24,503.05** (above the entire CPR band) would signal a Descending CPR reversal — a powerful signal where shorts who positioned based on the CPR structure are squeezed out, and the resulting covering rally targets H3 **24,512.29**, H4 **24,552.88**, and R1 **24,555.95** with potential for a full trend day up toward PDH **24,576.85** and OI resistance **24,500** (which would then be re-approached from the upside at a different dynamic).
|
▲ Upside Path → OI-R From a bull trigger above TC **24,503.05**, the upside path is: TC 24,503.05 → **H3 24,512.29** (Camarilla mean-reversion first resistance, take first partial profit — 30–40% of position) → **H4 24,552.88** (Camarilla breakout trigger, add on breakout with stop at H3) → **R1 24,555.95** (Traditional first target, second partial exit) → **PDH 24,576.85** (previous day high, psychological resistance and third partial) → **H5 24,600.29** approaching OI-R **24,500** zone (which at this point is being surpassed, unlocking H5 and H6 24,619.56 as final targets). Each level should be confirmed by 15-minute closes with expanding volume to distinguish genuine trend from mean-reversion bounce. |
▼ Downside Path → OI-S From a bear trigger below BC **24,482.15**, the downside path is: BC 24,482.15 → **OI support 24,450** (PE max OI, first test — watch for bounce or break) → **L3 24,431.11** (Camarilla mean-reversion zone, closely aligned with PDL 24,429.25 — retail long stop-losses clustered below 24,430 accelerate the move) → **L4 24,390.52** (Camarilla breakdown trigger, institutional shorts added here) → **S1 24,408.35** → **S2 24,345.00** and **L5 24,343.11** (dual support confluence at 24,343–24,345 zone, final intraday target). Volume expansion on each 15-minute candle below L3 24,431.11 confirms genuine institutional selling versus a short-term washout. |
| 🔴 OI-R: The **OI resistance at 24,500** (CE max OI strike) is the definitive ceiling in a flat-open scenario — call writers have sold massive quantities of 24,500 strike calls and will defend this level by selling futures aggressively on any approach above 24,492–24,500. This creates a gamma wall that makes trading above 24,500 extremely difficult without a strong external catalyst; even in a bull-trigger scenario above TC 24,503.05, traders should book partial profits at 24,500–24,503 and not assume a clean break without volume confirmation. | 🟢 OI-S: The **OI support at 24,450** (PE max OI strike) is the primary downside floor in a flat-open scenario — put writers at 24,450 hold large positions and will buy futures to delta-hedge as price approaches, creating a natural stabilization zone approximately 22 points below the flat open. In a flat open where OI support 24,450 is breached on a first 15-minute close, it triggers a cascade of put writer hedging that paradoxically adds volatility (not stability) — traders should not assume 24,450 always holds; a confirmed break below 24,450 on the first 15-minute close in a Narrow Descending CPR day is one of the most reliable bearish signals of the session. |
⚡ Key Trigger: **Bull trigger**: First 15-minute candle close above TC **24,503.05** — this signals a Descending CPR reversal and initiates a short-squeeze rally targeting H3 24,512.29, H4 24,552.88, and R1 24,555.95; the market psychology behind this trigger is that call writers at 24,500 (OI resistance) begin to cover as price threatens their short strikes, creating a reflexive upward impulse. **Bear trigger**: First 15-minute candle close below BC **24,482.15** and specifically below OI support **24,450** — this confirms the CPR is acting as overhead resistance, validating the Descending CPR structure and signalling a trending bear day where the initial target is L3 **24,431.11** (aligned with PDL 24,429.25), with momentum to L4 **24,390.52** and S1 **24,408.35** as put writers at 24,450 capitulate.
BANKNIFTY
Descending — Narrow (Width 0.07%)
▼ Bearish
Market Structure Trending (up or down trend) | Straddle BANKNIFTY Month ATM 57400 straddle is priced at **1,134.75 points** (Call 657.50 + Put 477.25), implying an expected move of approximately ±1,135 points to expiry on 25 Aug 2026 — this wide straddle reflects significant premium in BANKNIFTY options and means intraday moves of 200–400 points should be treated as normal fluctuation within the monthly expected range. The relatively higher call premium versus put premium (657.50 vs 477.25) suggests the market is pricing in a slight upside skew, though the overall structure remains bearish given the Descending CPR and the index closing below month max pain at 57,800. | Max Pain BANKNIFTY Month max pain is **57,800** (expiry 25 Aug 2026) — the current close of 57,446.25 sits **353.75 points below** month max pain, creating meaningful gravity toward 57,800 as expiry approaches. This 354-point gap indicates that option sellers are most comfortable with BANKNIFTY between 57,400 and 58,000, and any sustained move below 57,000 (OI support) or above 58,000 (OI resistance) would force option writers to hedge aggressively, amplifying directional momentum. |
Tomorrow's Complete Level Map
OI-R: 58,000 H6: 57,897.66 H5: 57,837.54 R2: 57,853.02 H4 ▶: 57,693.28 R1: 57,649.64 PDH: 57,607.25 H3 ↩: 57,569.77
TC: 57,425.06 P: 57,403.87 BC: 57,382.68
L3 ↩: 57,322.73 PDL: 57,158.10 S1: 57,200.49 L4 ▶: 57,199.22 S2: 56,954.72 L5: 57,054.96 L6: 56,994.84 S3: 56,751.34 OI-S: 57,000
↩ = Camarilla reversal point | ▶ = Camarilla breakout/breakdown trigger | OI-R/OI-S = Options wall (CE/PE max OI)
▲ Higher Open (Gap Up) — Open > Prev Close
▲ Bullish
Open lands: For a Descending CPR on BANKNIFTY, a gap-up places price above the CPR band (TC 57,425.06). With prev close at 57,446.25 already above TC 57,425.06 — note that the closing price is above TC, which is a classic 'Descending Trend Reversal' signal (prev close above TC). A minor gap-up of 0.05–0.25% opens in the 57,475–57,590 range, above TC 57,425.06 and approaching H3 57,569.77. A significant gap of 0.25–0.5% opens at 57,590–57,733, inside the H3–H4 Camarilla zone. A large gap exceeding 0.5% would push above 57,733 toward PDH 57,607.25 and OI resistance 58,000.
CPR role: Since BANKNIFTY's prev close (57,446.25) is already above TC (57,425.06), this is technically a **Descending Trend Reversal** scenario — the CPR band acts as a confirmed support base below price (not resistance), meaning the CPR band is a launch pad for upside in a gap-up. The two consecutive sessions of price above the Descending CPR TC (57,425.06) signal hidden strength and a potential trend change — a gap-up amplifies this reversal signal significantly.
Minor Gap (0.05–0.25%) — Structure Dominant
A minor gap up of 0.05–0.25% opens BANKNIFTY at approximately 57,475–57,590, placing price above TC **57,425.06** and into the zone between TC and H3 **57,569.77** — given that prev close (57,446.25) was already above TC (57,425.06), this minor gap amplifies the Descending Trend Reversal signal, indicating that the Descending CPR has failed to contain price on two successive sessions. The Narrow CPR (0.07% width — the tightest of all three indices today) means a trending day is extremely likely, and a minor gap in the direction of the reversal signal (upward) sets up a high-probability bullish trend day with the CPR band as support below. The first 15-minute close above H3 **57,569.77** (Camarilla mean-reversion zone) with above-average volume confirms the bull trend — book first partial at R1 **57,649.64**, trail stop to TC 57,425.06, and target H4 **57,693.28** and R2 **57,853.02** approaching OI resistance **58,000**.
Significant Gap (0.25–0.5%) — Balanced
A significant gap up of 0.25–0.5% opens BANKNIFTY at 57,590–57,733, landing inside or at the H3 **57,569.77** to H4 **57,693.28** Camarilla resistance cluster — price is immediately at mean-reversion resistance at the open, and the significant gap combined with the Descending Trend Reversal signal creates a balanced scenario where both gap-fill toward BC **57,382.68** and continuation toward H4 **57,693.28** are credible outcomes. Delta-hedging flows from CE writers at OI resistance 58,000 will cap upside rallies toward 57,800–58,000, while the month max pain gravity at 57,800 provides a target for bulls; the 30-minute confirmation rule from the Narrow CPR is: a first 15-minute close above H3 57,569.77 targets H4 57,693.28, R1 57,649.64, and ultimately OI-R **58,000**, while a failure to hold H3 57,569.77 on the first 15-minute candle targets gap-fill to P **57,403.87** then BC **57,382.68**. Partial profit at R1 57,649.64 is mandatory for any long entered below H3 57,569.77.
Large Gap (>0.5%) — Gap Direction Dominant
A large gap up exceeding 0.5% (above 57,733) opens BANKNIFTY near or above H4 **57,693.28** and approaching the H5 **57,837.54** to H6 **57,897.66** zone — month max pain at **57,800** sits within this zone, making it the primary target for longs and the primary resistance for option sellers who need BANKNIFTY to expire at 57,800. The gap-fill risk from this opening level back to TC **57,425.06** is approximately 270–400 points, which represents a meaningful portion of the daily range, so traders should sell OTM call spreads above 58,000 or buy puts for protection rather than chasing momentum longs at the open. The straddle context (Month 1,134.75 points) suggests a large gap consumes significant premium — the abort level for longs is a 15-minute close below H3 **57,569.77**, which signals institutional selling into the gap and shifts the day's narrative to a gap-fill bearish scenario targeting BC **57,382.68** and L3 **57,322.73**.
|
▲ Upside Path → OI-R The confirmed upside path from above TC **57,425.06**: TC 57,425.06 (support base) → **H3 57,569.77** (first partial profit, 30–40% of position at first 15-min close above) → **R1 57,649.64 and H4 57,693.28** (dual resistance cluster, second partial, stop trail to H3) → **H5 57,837.54** (approaching month max pain 57,800, significant profit-taking zone) → **H6 57,897.66** and finally **OI resistance 58,000** (CE max OI strike, the ultimate ceiling where CE writers will sell aggressively and gap-fill risk reverses). Volume confirmation is critical at each level — thin volume at H3 57,569.77 on first touch is a warning sign; thick green candles on the 15-minute chart confirm institutional buying. |
▼ Downside Path → OI-S Failure to hold above TC **57,425.06** on a gap-up in a Descending Trend Reversal scenario is a powerful reversal signal — it means the attempted CPR breakout has failed and institutional sellers have reasserted control. The failure path targets: TC 57,425.06 → P **57,403.87** → BC **57,382.68** (CPR floor, critical breakdown confirmation) → **L3 57,322.73** (Camarilla mean-reversion zone, retail stop-losses clustered just below previous day's range) → **L4 57,199.22** (Camarilla breakdown trigger, closely aligned with S1 57,200.49 — an important dual support zone) → **OI support 57,000** (PE max OI strike, ultimate downside target where put writers defend). |
| 🔴 OI-R: The **OI resistance at 58,000** (CE max OI strike) is 554+ points above the close — in a gap-up scenario this is the ultimate ceiling where call writers will defend with maximum aggression, selling futures to delta-hedge their short 58,000 calls and creating a powerful supply zone. The gamma pressure at 58,000 builds exponentially as price approaches closer to expiry (25 Aug 2026), meaning a gap-up that reaches 57,900–58,000 intraday should be treated as a high-probability reversal zone for intraday shorts, not a momentum breakout level — only a multi-day sustained hold above 58,000 would signal a genuine breakout past this OI wall. | 🟢 OI-S: The **OI support at 57,000** (PE max OI strike) is 446 points below the close and acts as the primary downside floor — in a gap-up scenario, 57,000 is largely irrelevant unless the gap-up completely fails and price sells off more than 400 points intraday, which would be a catastrophic day. However, the existence of massive put writing at 57,000 provides a psychological backstop for bulls — the knowledge that put writers will buy futures aggressively near 57,000 means that on any severe gap-up failure, 57,000–57,100 zone will see institutional buying interest supporting a bounce attempt. |
⚡ Key Trigger: The key trigger for BANKNIFTY gap-up scenario is a **first 15-minute candle close above H3 57,569.77** — this is the structural fulcrum because H3 represents the Camarilla mean-reversion zone where sellers typically appear; a confirmed 15-minute close above H3 57,569.77 signals that buying pressure has overwhelmed the first line of seller defense, activating the trend day thesis with targets at H4 **57,693.28** and R1 **57,649.64**. Failure to close above H3 57,569.77 on the first 15-minute candle — regardless of the gap size — indicates mean-reversion dynamics are active and the trade flips to short below TC **57,425.06** targeting L3 **57,322.73** and OI support **57,000**.
▼ Lower Open (Gap Down) — Open < Prev Close
▼ Bearish
Open lands: A gap-down on BANKNIFTY opens below prev close 57,446.25. A minor gap of 0.05–0.25% opens at 57,302–57,417, placing price below TC **57,425.06** and inside/below the CPR band. Note that prev close 57,446.25 is above TC 57,425.06 (Descending Trend Reversal), so a gap-down that opens below TC is a bearish reversal of the reversal. A significant gap of 0.25–0.5% opens at 57,159–57,302, below L3 **57,322.73** and approaching PDL **57,158.10**. A large gap exceeding 0.5% opens below 57,159, potentially below PDL 57,158.10 and approaching OI support **57,000**.
CPR role: In a gap-down that opens below TC **57,425.06** (below the entire Descending CPR), the CPR band immediately converts from a potential support (Descending Trend Reversal scenario) back to overhead resistance — the entire CPR band (BC 57,382.68 to TC 57,425.06) sits above the open and must be reclaimed to salvage any bullish intent. The most dangerous aspect of a gap-down here is that the Descending Trend Reversal reversal was already fragile (just one session of prev close above TC) — a gap-down invalidates this signal immediately and resets the bearish Descending CPR thesis.
Minor Gap (0.05–0.25%) — Structure Dominant
A minor gap down of 0.05–0.25% opens BANKNIFTY at approximately 57,302–57,417, placing price below TC **57,425.06** and potentially inside the CPR band (between BC 57,382.68 and TC 57,425.06) — this minor gap immediately invalidates the Descending Trend Reversal signal from prev close and reinstates the bearish Descending CPR thesis where the CPR band is overhead resistance. Minor gaps inside the prior day's range have gap-fill probability of 60–70%, so a quick recovery attempt toward TC **57,425.06** is likely in the first 15 minutes, but traders should fade this recovery if it fails to close a 15-minute candle above TC 57,425.06. If BC **57,382.68** holds as support on the first 15 minutes and TC 57,425.06 is reclaimed, the day flips neutral-to-bullish; failure to reclaim BC 57,382.68 targets L3 **57,322.73** and then the aligned L4/S1 cluster at **57,199.22–57,200.49**.
Significant Gap (0.25–0.5%) — Balanced
A significant gap down of 0.25–0.5% opens BANKNIFTY at 57,159–57,302, landing at or just above PDL **57,158.10** and below L3 **57,322.73** — at this opening level, price has bypassed both the CPR band and the L3 Camarilla mean-reversion zone, placing the entire CPR (BC 57,382.68 to TC 57,425.06) as distant overhead resistance requiring a 200–270 point recovery just to reach the CPR base. The 30-minute reclaim rule applies: if price recovers above L3 **57,322.73** within the first two 15-minute candles and a 30-minute close is sustained above BC **57,382.68**, the bear thesis is paused and a recovery play targets P **57,403.87** and TC **57,425.06**. The primary bear continuation path from this significant gap targets L4 **57,199.22** (Camarilla breakdown trigger, closely aligned with S1 **57,200.49** — a dual support wall) and then OI support **57,000** — put writers at 57,000 will buy futures as price approaches, potentially generating a bounce, but month max pain at 57,800 creates strong gravitational pressure upward over the remaining sessions.
Large Gap (>0.5%) — Gap Direction Dominant
A large gap down exceeding 0.5% (below 57,159) opens BANKNIFTY at or below PDL **57,158.10**, potentially approaching the L4/S1 dual support cluster at **57,199.22–57,200.49** at the open or even testing OI support **57,000** — this is a critical support zone because put writers at 57,000 hold massive positions and will buy BANKNIFTY futures aggressively to delta-hedge as the strike comes under threat, creating a strong intraday floor typically within the first 30 minutes of trading. With India VIX data unavailable, the exact premium expansion cannot be quantified, but a large BANKNIFTY gap of this magnitude with Month straddle at 1,134.75 means the daily expected move is being consumed rapidly — straddle sellers will rush to buy back premium, injecting volatility in both directions. The abort level for a gap-recovery long is a 30-minute close below PDL **57,158.10** and L5 **57,054.96**, which opens the path to L6 **56,994.84** and the critical OI support floor at **57,000** — a sustained hourly close below 57,000 would be a severe bearish signal for the weekly outlook.
|
▲ Upside Path → OI-R The recovery path from a gap-down begins with a hold of **L3 57,322.73** (Camarilla mean-reversion zone, first bounce support), then reclaim of BC **57,382.68** (CPR floor, 30-minute close required), followed by P **57,403.87** and TC **57,425.06** (full CPR reclaim = bull signal), and then targeting H3 **57,569.77** and R1 **57,649.64** as the session progresses — genuine recovery is confirmed by green 30-minute candles with expanding volume at each successive level. A dead-cat bounce pattern (sharp 5-minute rally to BC 57,382.68 followed by reversal candle) should be sold into, not bought. |
▼ Downside Path → OI-S The primary bear continuation from a gap-down targets: **L3 57,322.73** (Camarilla mean-reversion zone, retail stop-losses concentrated near PDL 57,158.10 accelerate the move below L3) → **L4 57,199.22 and S1 57,200.49** (a critical dual support cluster at the same price level, 57,199–57,201, where institutional buyers typically attempt a first defense) → **L5 57,054.96** (Camarilla extended downside target) → **OI support 57,000** (PE max OI, ultimate floor where put writer delta-hedging buying creates maximum stabilization pressure). Volume surge on a 15-minute close below L4 57,199.22 with no recovery within the same candle confirms the bear trend is institutional, not just stop-run driven. |
| 🔴 OI-R: The **OI resistance at 58,000** (CE max OI strike) is the dominant overhead ceiling and is largely irrelevant in a gap-down scenario from a trading standpoint — it sits 554+ points above the close and would require an extraordinary intraday reversal to approach. However, CE writers at 58,000 are benefiting from the gap-down as their short call positions gain value, and their delta-hedging activity (selling futures on rallies) continues to suppress any recovery attempt toward 57,600–57,700 — making them an indirect force in limiting the upside of any gap-fill rally even without 58,000 being directly tested. | 🟢 OI-S: The **OI support at 57,000** (PE max OI strike) is the **primary bear target and critical PUT monetisation zone** in a gap-down scenario — as BANKNIFTY approaches 57,000, put writers who sold 57,000 PEs face increasing delta exposure and must buy futures to hedge, injecting significant buying pressure at this level. If 57,000 holds on a 30-minute close basis, it confirms put writer support and suggests a strong intraday reversal; a sustained 30-minute close below 57,000 signals put writer capitulation and opens the path to S2 **56,954.72**, L6 **56,994.84**, and S3 **56,751.34** — a scenario that would likely be accompanied by a significant VIX spike and margin pressure across banking sector longs. |
⚡ Key Trigger: The key trigger for BANKNIFTY gap-down is **recovery and 30-minute close above BC 57,382.68** for bulls, or **first 15-minute close below L3 57,322.73** for bears. BC **57,382.68** is the structural fulcrum because it is the floor of the Descending CPR — a 30-minute close above BC 57,382.68 signals that buyers absorbed the gap-down and the CPR is now acting as support, shifting bias toward TC **57,425.06** and recovery, while a first 15-minute close below L3 **57,322.73** confirms that the gap-down is NOT being bought and the trending bear day is active, with L4 **57,199.22** and OI support **57,000** as sequential targets.
◆ Near Flat Open — Open ≈ Prev Close (±0.05%)
◆ Neutral
Open lands: A flat open of ±0.05% on BANKNIFTY places price at approximately 57,417–57,475. Given that prev close (57,446.25) is already above TC (57,425.06), a flat open lands above TC 57,425.06 — this is the Descending Trend Reversal scenario where a flat open is 'further above TC (confirming hidden strength).' The flat open at 57,446.25 ± 28 points = 57,418–57,474, meaning even at the lower end (57,418), price is just below TC 57,425.06, and at the midpoint (57,446), it is above TC.
CPR role: With a flat open above TC **57,425.06** in a Descending Trend Reversal context, the CPR band acts as a **support launch pad** — the entire CPR band (BC 57,382.68 to TC 57,425.06) is below the open, providing a cushion of support. The Narrow CPR width of 0.07% (the tightest across all indices today) creates an extremely high-probability trending day, and the flat open above TC in a Descending Trend Reversal scenario is one of the most powerful bullish signals in CPR analysis — it indicates hidden strength that market participants have not yet fully acted upon.
Near Flat (±0.05%)
A flat open on BANKNIFTY with a Descending Narrow CPR (0.07% width) and prev close already above TC **57,425.06** creates a **Descending Trend Reversal flat open** — this is an extremely powerful signal because two sessions of prev close above the Descending TC combined with a flat open above TC indicates sustained hidden strength and a high probability of a trend reversal day to the upside. The 0.07% Narrow CPR width means the trending day probability is among the highest possible — narrower CPR = more energy compressed = more explosive directional move when the 15-minute trigger fires. The key threshold is TC **57,425.06**: if the first 15-minute candle closes above TC 57,425.06 with the flat open already above it, this is a double-confirmation bull signal — the CPR band beneath acts as support and the path toward H3 **57,569.77**, H4 **57,693.28**, R1 **57,649.64**, and ultimately OI resistance **58,000** is open. Conversely, if the flat open at 57,446 drops back below TC **57,425.06** on the first 15-minute candle, it signals that the Descending Trend Reversal is failing and sellers are reasserting control — a 15-minute close below BC **57,382.68** would then trigger the full bear case targeting L3 **57,322.73**, L4 **57,199.22**, and OI support **57,000**.
|
▲ Upside Path → OI-R From the flat open above TC **57,425.06** with bull trigger above H3 **57,569.77**: H3 57,569.77 (first partial, 30–40% position, 15-min close confirmation) → **H4 57,693.28** (Camarilla breakout trigger, second partial, stop trail to TC 57,425.06) → **R1 57,649.64** (Traditional first target, overlapping with H4 zone — book combined partial here) → **H5 57,837.54** (Camarilla extended target, approaching month max pain 57,800 — significant take-profit zone) → **H6 57,897.66** → **OI resistance 58,000** (CE max OI — definitive ceiling, close majority of position within 57,900–58,000 and avoid chasing above). Volume confirmation: 15-minute candles with body-to-wick ratio above 3:1 and increasing volume at each level confirm genuine institutional buying rather than short-covering. |
▼ Downside Path → OI-S From the bear trigger below BC **57,382.68**: BC 57,382.68 → P **57,403.87** (passed through on breakdown) → L3 **57,322.73** (Camarilla mean-reversion zone, first downside target — retail stop-losses from the Descending Trend Reversal longs clustered here accelerate the move) → **L4 57,199.22 and S1 57,200.49** (critical dual support cluster at 57,199–57,201, institutional first defense zone — watch for 30-minute bounce here before continuation) → **L5 57,054.96** (extended Camarilla target) → **OI support 57,000** (PE max OI, ultimate intraday bear target where put writer buying creates maximum stabilization). The speed of decline from BC 57,382.68 to L3 57,322.73 (60 points) is the key tell — if covered in under 15 minutes, it signals panic selling and a 57,000 test becomes high probability. |
| 🔴 OI-R: The **OI resistance at 58,000** (CE max OI strike) sits **553.75 points above** the flat open and acts as the definitive ceiling for intraday trading — in the flat open scenario, this level functions as the ultimate target for a bullish trend day rather than an immediate concern, and CE writers at 58,000 will only begin active delta-hedging (selling futures) as price approaches 57,700–57,900. The existence of this OI wall at 58,000 combined with month max pain at 57,800 creates a dual resistance zone between 57,800–58,000 where profit-booking on longs is strongly advised regardless of momentum. | 🟢 OI-S: The **OI support at 57,000** (PE max OI strike) represents the primary downside floor and ultimate bear target in the flat open scenario — in a Descending Trend Reversal flat open where the bull signal is the base case, OI support 57,000 functions as the 'worst case abort level' for longs: if price reaches 57,000 from a flat open above TC 57,425.06, it means a catastrophic intraday failure of the bull thesis, likely triggered by a macro event, and put writers at 57,000 buying futures will generate a bounce at this level that can be traded as a reversal scalp. PE base at 57,000 in the monthly context (with expiry on 25 Aug 2026) provides a meaningful floor for the index over the remaining sessions, supporting a recovery bias even after a severe intraday decline. |
⚡ Key Trigger: **Bull trigger**: First 15-minute candle close above **H3 57,569.77** from a flat open above TC — since the flat open is already above TC 57,425.06, the next confirmation level is H3 57,569.77 (Camarilla mean-reversion zone), and a 15-minute close above H3 signals that buying pressure is sustained and not mean-reverting, activating the trend day bull thesis with targets at H4 **57,693.28**, R1 **57,649.64**, month max pain **57,800**, and OI resistance **58,000**. **Bear trigger**: First 15-minute candle close below BC **57,382.68** — this invalidates the Descending Trend Reversal, confirms the Descending CPR is re-asserting as overhead resistance, and activates the bear thesis targeting L3 **57,322.73**, L4 **57,199.22**, S1 **57,200.49**, and OI support **57,000**; the psychological impact of a BC breach after two sessions of hidden strength is sharp and often leads to a rapid 200–300 point decline.
SENSEX
Descending — Medium (Width 0.11%)
▼ Bearish
Market Structure Balanced or transitional | Straddle SENSEX Week ATM 78200 straddle is priced at **606.90 points** (Call 320.00 + Put 286.90), implying an expected move of approximately ±607 points for the weekly expiry on 13 Aug 2026 (tomorrow) — with expiry just one session away, this straddle pricing indicates significant weekly gamma risk and means the market expects SENSEX to remain roughly within the 77,593–78,807 range by close tomorrow. The Month ATM 78200 straddle at **1,497.10 points** (Call 882.10 + Put 615.00) implies ±1,497 points to the 27 Aug 2026 expiry, showing the market is pricing in substantial volatility over the next two weeks — the higher call premium versus put premium (882.10 vs 615.00) suggests a mild upside skew in monthly positioning. | Max Pain SENSEX Week max pain is **78,300** (expiry 13 Aug 2026 — tomorrow), and Month max pain is **78,500** (expiry 27 Aug 2026). The current close of 78,154.25 sits **145.75 points below** Week max pain (78,300) and **345.75 points below** Month max pain (78,500), creating strong gravitational pull toward the 78,300–78,500 range into expiry. With weekly expiry tomorrow, option writers will exert maximum pressure to keep SENSEX near 78,300 — any gap-up toward this level tomorrow morning should be treated with caution as a potential fade zone where call writers defend aggressively. |
Tomorrow's Complete Level Map
OI-R: 80,000 R3: 78,888.11 H6: 78,616.39 H5: 78,556.31 R2: 78,698.94 H4 ▶: 78,408.08 R1: 78,426.60 PDH: 78,509.77 H3 ↩: 78,281.17
TC: 78,279.01 P: 78,237.43 BC: 78,195.85
L3 ↩: 78,027.33 PDL: 78,048.26 S1: 77,965.09 L4 ▶: 77,900.42 S2: 77,775.92 L5: 77,752.19 L6: 77,692.11 S3: 77,503.58 OI-S: 76,000
↩ = Camarilla reversal point | ▶ = Camarilla breakout/breakdown trigger | OI-R/OI-S = Options wall (CE/PE max OI)
▲ Higher Open (Gap Up) — Open > Prev Close
▲ Bullish
Open lands: For a Descending Medium CPR on SENSEX, a gap-up opens price above the CPR band (TC 78,279.01). Note a critical observation: TC 78,279.01 is extremely close to H3 78,281.17 — these two levels are separated by only 2.16 points, creating a powerful dual-layer resistance at 78,279–78,281. A minor gap up of 0.05–0.25% opens SENSEX at 78,193–78,350, potentially inside the CPR band (BC 78,195.85 to TC 78,279.01) or marginally above TC 78,279.01. A significant gap of 0.25–0.5% opens at 78,350–78,546, above TC 78,279.01 and H3 78,281.17, inside the H4 78,408.08 to H5 78,556.31 zone. A large gap exceeding 0.5% would open above 78,546, approaching PDH 78,509.77 or Week max pain 78,300.
CPR role: In a Descending Medium CPR gap-up scenario for SENSEX, the CPR band (BC 78,195.85 to TC 78,279.01) acts as a **launch pad if held** or **trap door if failed** — the Medium CPR width (0.11%) means a 30-minute close above TC 78,279.01 is required for confirmation (not just 15-minute as with Narrow CPR), which gives more time for the gap to prove or disprove its validity. The confluence of TC (78,279.01) and H3 (78,281.17) at virtually the same price creates an exceptionally important dual-layer resistance-turned-support level that will be the most-watched level of the session.
Minor Gap (0.05–0.25%) — Structure Dominant
A minor gap up of 0.05–0.25% opens SENSEX at approximately 78,193–78,350, placing the opening either inside the CPR band (BC 78,195.85 to TC 78,279.01) or marginally above TC 78,279.01 and H3 **78,281.17** — the confluence of TC and H3 at 78,279–78,281 means a minor gap either opens directly at this key dual-layer resistance or just below it. For the Medium CPR confirmation rule, traders must wait for a **30-minute close above TC 78,279.01 / H3 78,281.17** to validate the bull case — a single 15-minute close is insufficient for Medium CPR width. If the 30-minute close above H3 78,281.17 is confirmed with above-average volume, the first target is H4 **78,408.08** (take partial at 40% position), followed by R1 **78,426.60** (Traditional first target, second partial), with Week max pain **78,300** already acting as the immediate magnet — SENSEX expiry tomorrow means option writers will push price toward 78,300 aggressively, making a move to and slightly above 78,300 the highest probability outcome.
Significant Gap (0.25–0.5%) — Balanced
A significant gap up of 0.25–0.5% opens SENSEX at 78,350–78,546, above TC **78,279.01** and H3 **78,281.17**, and inside the H4 **78,408.08** to H5 **78,556.31** resistance zone — price is immediately at Camarilla mean-reversion territory where sellers are likely to appear, and with the weekly expiry on 13 Aug 2026 (tomorrow), call writers at OI resistance 80,000 are not directly threatened, but those who sold 78,500–79,000 calls face delta pressure and will sell SENSEX futures to hedge. The Month CPR band (BC 77,069.67 to TC 77,752.99) and Week CPR band (BC 78,558.61 to TC 78,677.51) both act as overhead resistance in the 78,558–78,677 range — meaning a significant gap-up opens close to the bottom of the Week CPR band, creating triple resistance at H4 78,408.08, Week CPR BC 78,558.61, and H5 78,556.31. The 30-minute confirmation rule requires two consecutive 30-minute closes above H4 **78,408.08** to justify holding longs for a move toward H5 **78,556.31** and R1 **78,426.60**; partial profit is mandatory at H4 78,408.08 and R1 78,426.60.
Large Gap (>0.5%) — Gap Direction Dominant
A large gap up exceeding 0.5% (above 78,546) opens SENSEX above PDH **78,509.77** and into the H5 **78,556.31** to H6 **78,616.39** Camarilla zone — this is the 'extension' Camarilla zone where mean-reversion is dominant and probability of a gap fill back to TC **78,279.01** is very high, especially given that this gap would push price toward the Week CPR band (BC 78,558.61) which acts as resistance, creating a powerful convergence of Camarilla H5/H6 and Week CPR resistance in the 78,556–78,677 zone. With weekly SENSEX expiry on 13 Aug 2026 (tomorrow) and Week max pain at 78,300, a large gap up toward 78,600 would significantly stress call writers at 78,500–79,000 strikes, but the gravitational pull of max pain at 78,300 remains — suggesting that even in a large gap-up, price will likely pull back toward 78,300 by the end of the session. The Month straddle of 1,497.10 points and the Week straddle of 606.90 points together suggest this level is at the extreme of weekly expected range — selling OTM call spreads above 78,600 or buying puts for a reversal trade are the preferred strategies for experienced traders at this opening level.
|
▲ Upside Path → OI-R The confirmed upside path from 30-minute close above TC **78,279.01** / H3 **78,281.17**: → **H4 78,408.08** (Camarilla breakout trigger, first partial exit 40% position — book here given week max pain 78,300 is already passed) → **R1 78,426.60** (Traditional first target, closely aligned with H4 78,408.08 at just 18 points apart — use as combined partial zone) → **PDH 78,509.77** (previous day high, psychological resistance, second partial 30% position) → **H5 78,556.31** approaching Week CPR BC **78,558.61** (Camarilla-Weekly CPR dual resistance, trailing stop moves to H4) → **OI resistance 80,000** is the ultimate ceiling but is 1,846 points away from the open and unlikely to be tested intraday — it functions as a reference for monthly positioning rather than an intraday target. Confirm each target with expanding 30-minute candle volume. |
▼ Downside Path → OI-S Gap-up failure below TC **78,279.01** (30-minute close inside CPR or below BC 78,195.85) triggers a trap-door reversal: TC 78,279.01 → P **78,237.43** → BC **78,195.85** (CPR floor breakdown level) → **L3 78,027.33** (Camarilla mean-reversion zone, closely aligned with PDL 78,048.26 at just 21 points apart — retail long stop-losses cluster below PDL 78,048.26, accelerating the move toward L3) → **L4 77,900.42** (Camarilla breakdown trigger) → **S1 77,965.09** (Traditional first support target, between L3 and L4) → **L5 77,752.19** and **L6 77,692.11** (Camarilla extended downside zone) → **OI support 76,000** (PE max OI, ultimate floor for the month). The speed of L3 78,027.33 to PDL 78,048.26 breach is the critical tell — any 15-minute candle that closes below both levels simultaneously with volume expansion signals institutional conviction on the downside. |
| 🔴 OI-R: The **OI resistance at 80,000** (CE max OI strike for SENSEX) sits an extraordinary **1,845.75 points above** the close — this level is not an intraday trading target but rather a structural monthly ceiling that call writers have built, preventing any sustained move above 80,000 through expiry on 27 Aug 2026. In a gap-up scenario, OI resistance 80,000 acts as a psychological anchor confirming that the market has abundant room to move between current levels and 80,000 before call writers feel truly threatened — this means the gap-up's ceiling is more practically defined by PDH **78,509.77**, Week CPR BC **78,558.61**, and Camarilla H5 **78,556.31** rather than the distant 80,000 OI wall. | 🟢 OI-S: The **OI support at 76,000** (PE max OI strike for SENSEX) is **2,154.25 points below** the close — in a gap-up scenario, this level is entirely irrelevant for intraday trading and serves only as a monthly structural floor confirming that put writers have set a floor far below current prices. The practical implication is that SENSEX has significant room to decline intraday without threatening the monthly OI support structure — making day traders rely on the nearer CPR, Camarilla, and Week max pain levels (78,300) as functional intraday supports rather than the distant 76,000 PE wall. |
⚡ Key Trigger: The key trigger for SENSEX gap-up (Medium CPR) is a **30-minute close above TC 78,279.01 and H3 78,281.17** (dual-layer resistance, virtually same price) — this 30-minute confirmation requirement (vs 15-minute for Narrow CPR) reflects the Medium CPR's characteristic of allowing retests and balanced price action before commitment, and a 30-minute close above this dual-layer confirms that buyers have decisively absorbed seller pressure at the CPR top. Failure to generate a 30-minute close above TC 78,279.01 (closing inside the CPR band or below BC 78,195.85) inverts the setup to a gap-up failure bearish scenario — target L3 **78,027.33** (Camarilla mean-reversion), PDL **78,048.26** (previous day low), and S1 **77,965.09** as sequential downside targets.
▼ Lower Open (Gap Down) — Open < Prev Close
▼ Bearish
Open lands: A gap-down on SENSEX opens below prev close 78,154.25. A minor gap of 0.05–0.25% opens at 77,958–78,115, placing the opening below PDL **78,048.26** (minor gap lower end) and below L3 **78,027.33** (Camarilla mean-reversion zone). A significant gap of 0.25–0.5% opens at 77,763–77,958, inside the L4 **77,900.42** to L3 **78,027.33** zone and near S1 **77,965.09**. A large gap exceeding 0.5% opens below 77,763, near L5 **77,752.19** and L6 **77,692.11**, approaching S2 **77,775.92**.
CPR role: In a Descending Medium CPR gap-down, the entire CPR band (BC 78,195.85 to TC 78,279.01) sits substantially above the open — the CPR acts as **distant overhead resistance** that requires a 40–125 point rally just to reach BC 78,195.85 (at a minor gap), making recovery difficult. The Medium CPR width means retests toward BC 78,195.85 are possible during the session, but the 30-minute confirmation rule requires sustained price above BC for a full CPR reclaim. With TC 78,279.01 and H3 78,281.17 virtually identical, the dual-layer resistance at 78,279–78,281 becomes an almost impenetrable ceiling for any gap-down recovery attempt within normal intraday volatility.
Minor Gap (0.05–0.25%) — Structure Dominant
A minor gap down of 0.05–0.25% opens SENSEX at 77,958–78,115 — critically, even the upper end of this range (78,115) is below both the CPR band (BC 78,195.85) and PDL **78,048.26**, meaning a minor gap down opens in or near bear territory relative to yesterday's session low. Minor gaps within the prior day's range have 60–70% gap-fill probability, so a recovery attempt toward BC **78,195.85** is expected in the first 30–60 minutes — however, for a Medium CPR Descending configuration, the **30-minute close rule** requires a confirmed 30-minute candle above BC 78,195.85 to validate any recovery. If the recovery rally stalls at BC 78,195.85 or fails to generate a 30-minute close above it, the failed recovery becomes a short signal targeting L3 **78,027.33**, then L4 **77,900.42** and S1 **77,965.09**, with the SENSEX Week max pain at **78,300** providing overhead gravity that traps sellers between PDL 78,048.26 and 78,300.
Significant Gap (0.25–0.5%) — Balanced
A significant gap down of 0.25–0.5% opens SENSEX at 77,763–77,958, landing inside the L3 **78,027.33** to L4 **77,900.42** Camarilla zone — price opens with the Camarilla mean-reversion support (L3 78,027.33) above it, meaning bears control the opening and recovery requires reclaiming L3 first before even approaching the CPR. The 30-minute recovery rule for Medium CPR applies: a 30-minute close above L3 **78,027.33** signals absorption of selling and a potential recovery toward BC **78,195.85**; failure to reclaim L3 78,027.33 within the first 30 minutes confirms the bear case and targets L4 **77,900.42** (Camarilla breakdown trigger), S1 **77,965.09** (Traditional first support), and L5 **77,752.19**. Weekly SENSEX expiry tomorrow (13 Aug 2026) with Week max pain at **78,300** means that option writers need SENSEX near 78,300 — a significant gap down that pushes price to 77,800–77,958 creates maximum pain for put buyers and triggers potential mean-reversion buying by institutions seeking to pin SENSEX near 78,300 by expiry.
Large Gap (>0.5%) — Gap Direction Dominant
A large gap down exceeding 0.5% (below 77,763) opens SENSEX near L5 **77,752.19**, L6 **77,692.11**, or S2 **77,775.92** — a zone that is 400+ points below yesterday's close and within striking distance of the Month CPR TC at **77,752.99**, creating a convergence of Camarilla L5/L6 and Monthly CPR resistance in the 77,692–77,753 area that will be critical for the session's direction. With SENSEX Weekly expiry tomorrow and Week max pain at 78,300, a large gap down to this level represents an extreme over-extension that puts put writers at 78,000–78,200 under severe pressure — their delta-hedging (buying SENSEX futures) could generate a sharp intraday reversal V-bounce from L5/L6 zone, making these levels attractive for scalp longs with tight stops below L6 **77,692.11**. The Month straddle of 1,497.10 points suggests the market prices a move this large is within the monthly expected range — however, the straddle's put side at 615.00 would have nearly full value at these levels, meaning straddle sellers scramble to buy back puts and inject buying, creating a mechanical reversal pressure at L5 **77,752.19** and L6 **77,692.11**.
|
▲ Upside Path → OI-R Recovery from gap-down begins with absorption at or near PDL **78,048.26** and L3 **78,027.33** (15-minute hold — no new 15-minute close below L3), followed by a rally toward BC **78,195.85** (30-minute close required to confirm CPR reclaim), then P **78,237.43**, TC **78,279.01** / H3 **78,281.17** (dual-layer resistance — 30-minute close above both required), and finally H4 **78,408.08** approaching Week max pain **78,300** and R1 **78,426.60**. Genuine recovery is characterized by declining selling volume and expanding buying volume on each successive 30-minute candle — a one-candle spike recovery without volume expansion is classified as a dead-cat bounce and should be shorted at BC 78,195.85 with a stop above TC 78,279.01. |
▼ Downside Path → OI-S The primary bear path from gap-down: **L3 78,027.33** (Camarilla mean-reversion, closely aligned with PDL 78,048.26 — retail stop-losses below this dual support accelerate the cascade, first 15-min close below confirms) → **S1 77,965.09** (Traditional first support, 30-min partial profit zone for shorts) → **L4 77,900.42** (Camarilla breakdown trigger, institutional shorts add positions here, second partial) → **L5 77,752.19** and **S2 77,775.92** (Camarilla extended downside zone and Traditional S2 — very close in value, forming a major support cluster at 77,752–77,776) → **L6 77,692.11** (Camarilla extreme downside) → ultimate **OI support 76,000** (PE max OI, monthly floor). Volume on the first breach of L3 78,027.33 with a 15-minute close below is the critical tell — expanding volume confirms institutional conviction; thin volume suggests a stop-run that quickly reverses. |
| 🔴 OI-R: The **OI resistance at 80,000** (CE max OI for SENSEX month) remains a distant overhead ceiling at 1,846 points above the close — in a gap-down scenario, this level is irrelevant for intraday trading direction. However, CE writers at 80,000 and nearer strikes (78,500–79,000) are benefiting from the gap-down as their short call positions gain time-value; their delta-hedging activity (selling SENSEX futures on rallies) creates steady selling pressure against any recovery attempt above BC **78,195.85**, making the CPR band recovery effort doubly difficult as both the CPR structure and CE writer supply converge at 78,195–78,279. | 🟢 OI-S: The **OI support at 76,000** (PE max OI for SENSEX month) is 2,154 points below the close — in a gap-down scenario, it functions as the structural monthly floor that gives put writers their anchor, not as a practical intraday target. The more relevant put writing concentration for tomorrow's weekly expiry is near **78,000–78,200** (nearer to current price), and PE writers at these weekly strikes will buy SENSEX futures as price approaches their short put strikes — creating mechanical buying support near L3 **78,027.33** and BC **78,195.85** that traders should be aware of when evaluating gap-down recovery potential in the context of tomorrow's weekly expiry. |
⚡ Key Trigger: The key trigger for SENSEX gap-down (Medium CPR) has two parts: **Bear confirmation** — first 15-minute close below L3 **78,027.33** (aligned with PDL 78,048.26) confirms the bear case is active, targets L4 **77,900.42**, S1 **77,965.09**, and L5 **77,752.19** in sequence. **Bull trigger (recovery)** — **30-minute close above BC 78,195.85** signals the gap-down was fully absorbed and CPR reclaim is underway, shifting bias toward TC **78,279.01** / H3 **78,281.17** and Week max pain **78,300** as the primary recovery targets. The 30-minute (not 15-minute) confirmation for Medium CPR is critical — a single 15-minute recovery spike to BC 78,195.85 should NOT be bought; only a sustained 30-minute close validates the recovery thesis.
◆ Near Flat Open — Open ≈ Prev Close (±0.05%)
◆ Neutral
Open lands: A flat open of ±0.05% on SENSEX places price at approximately 78,115–78,193. This range lands entirely below BC **78,195.85** — the flat open is below the entire Descending CPR band (BC 78,195.85 to TC 78,279.01), consistent with the Descending CPR rule where 'flat open lands near TC' but since prev close (78,154.25) is well below TC (78,279.01), the flat open is actually well below the CPR band, making the CPR band an overhead resistance structure of approximately 42–125 points above the opening level.
CPR role: The CPR band (BC 78,195.85 to TC 78,279.01) acts as a **decision zone and overhead compression band** — in a flat open, the Medium CPR width (0.11%) requires a 30-minute confirmation before committing to a directional trade, and the CPR's proximity above the flat open (BC is only 42 points above the flat open at 78,154) means the first attempt to reach BC 78,195.85 will come quickly. The critical distinction from the Narrow NIFTY scenario: Medium CPR allows for retests, so a single failed attempt at BC 78,195.85 should not be automatically shorted — only a 30-minute close below the opening level confirms the bear case.
Near Flat (±0.05%)
A flat open on SENSEX with a Descending Medium CPR (0.11% width) and Weekly expiry tomorrow (13 Aug 2026) creates a **high-gamma, expiry-pinning environment** where the SENSEX Week max pain at **78,300** exerts strong gravitational pull — option writers will actively defend 78,300 by selling rallies above it and buying dips below, making 78,300 the most likely intraday closing zone regardless of the opening direction. The Medium CPR width (0.11%) indicates a balanced session where both bullish and bearish outcomes are credible — unlike the Narrow CPR trend-day dynamics in NIFTY and BANKNIFTY, SENSEX is likely to see at least one meaningful retest and potential false breakout before establishing the day's direction. The flat open below BC **78,195.85** means the first 30 minutes will be a test of whether the CPR band can be reclaimed: a 30-minute close above BC 78,195.85 is the first bull signal targeting P **78,237.43**, TC **78,279.01** / H3 **78,281.17**, and ultimately Week max pain 78,300 / H4 **78,408.08**. A first 15-minute close below the flat open level (below 78,115–78,154) with no recovery in 30 minutes shifts the bias to bearish, targeting L3 **78,027.33** (aligned with PDL 78,048.26), L4 **77,900.42**, and S1 **77,965.09** — and with OI support at a distant 76,000, the practical intraday floor is L5 **77,752.19** on a severe bear day.
|
▲ Upside Path → OI-R From the 30-minute close above BC **78,195.85** bull trigger: BC 78,195.85 (now support — buy retests here) → **P 78,237.43** (Pivot, first intraday check — hold 15-minute candle above confirms continuation) → **TC 78,279.01 / H3 78,281.17** (dual-layer critical resistance, 30-minute close above required, partial profit 40% at this level given Week max pain proximity) → **H4 78,408.08** (Camarilla breakout trigger, second partial 30%) → **R1 78,426.60** (Traditional first target, third partial 20%) → **PDH 78,509.77** (previous day high, final target — exit remaining position by the end of the hour before weekly expiry dynamics shift). Volume confirmation: 30-minute candles with expanding green volume at each target confirm institutional participation vs retail short-covering only. |
▼ Downside Path → OI-S From the bear trigger below PDL **78,048.26** / L3 **78,027.33**: L3 78,027.33 (Camarilla mean-reversion zone — retail stop-losses from overnight longs cluster below PDL 78,048.26, accelerating move to L3) → **S1 77,965.09** (Traditional first support, first partial profit zone for shorts — book 35% here) → **L4 77,900.42** (Camarilla breakdown trigger, second partial 35%) → **L5 77,752.19** and **S2 77,775.92** (Camarilla extended downside and Traditional S2 — very close at 77,752–77,776, final target zone, exit remaining 30%) → **L6 77,692.11** (extreme Camarilla target, only on catastrophic days). Volume expansion on first 15-minute break below L3 78,027.33 is the confirmation — any decline to L3 on thin volume is likely a stop-run and not a genuine trend move. |
| 🔴 OI-R: The **OI resistance at 80,000** (CE max OI for SENSEX month) is a distant structural ceiling that is irrelevant as an intraday target in the flat-open scenario — however, the weekly expiry tomorrow means the more actionable CE resistance is at the **78,300–78,500 strike range** (near Week max pain 78,300 and Month max pain 78,500), where call writers for tomorrow's weekly expiry will sell futures aggressively on any approach above 78,300–78,350. Traders should treat 78,300 as a practical intraday ceiling for tomorrow's session given the gravitational max pain dynamics — booking profits on longs at or near 78,300 is strongly advised regardless of the momentum reading. | 🟢 OI-S: The **OI support at 76,000** (PE max OI for SENSEX month) is 2,154 points below the flat open and serves as a structural monthly floor confirming that put writers have built a wide margin of safety below the current price — this distant support means that intraday dips to L3 **78,027.33**, L4 **77,900.42**, and even L5 **77,752.19** should be seen as opportunities for recovery rather than signs of structural breakdown, as the monthly PE base at 76,000 provides a massive buffer. The more actionable PE support for tomorrow's weekly expiry is near the **77,800–78,000** range (nearer weekly put strikes), where put writers for the 13 Aug expiry will buy SENSEX futures to delta-hedge as these strikes come under pressure — creating a mechanical support in the 77,900–78,050 zone (aligned with L4 77,900.42 and L3 78,027.33) that reinforces the Camarilla support levels. |
⚡ Key Trigger: **Bull trigger**: **30-minute close above BC 78,195.85** — this is the structural fulcrum for SENSEX's flat open because BC represents the entry point into the CPR band; a 30-minute hold above BC 78,195.85 means buyers have overcome the initial CPR resistance and the path to P 78,237.43 → TC **78,279.01** / H3 **78,281.17** → Week max pain **78,300** → H4 **78,408.08** → R1 **78,426.60** is open, with the weekly expiry gravitational pull toward 78,300 acting as a powerful accelerant for the bull case. **Bear trigger**: First 15-minute close below PDL **78,048.26** or L3 **78,027.33** — this dual breach (two closely aligned support levels, only 21 points apart) confirms that sellers have taken control and the CPR band will remain as overhead resistance for the session, activating the bear path toward L4 **77,900.42**, S1 **77,965.09**, L5 **77,752.19**, and S2 **77,775.92**.
📊 VIX Insight: India VIX data is unavailable for 11 Aug 2026, which limits precise implied-volatility context for tomorrow's session — in the absence of VIX data, traders should rely more heavily on the straddle pricing as a volatility proxy: NIFTY Month straddle at 425.10 points, BANKNIFTY Month at 1,134.75 points, and SENSEX Week at 606.90 points suggest moderate volatility expectations, not a panic-level environment. Without VIX confirmation of a spike, the synchronized -0.42% to -0.49% decline across all three indices is more likely a measured institutional selling day rather than a panic-driven selloff — this supports a bias toward mean-reversion gap-fill attempts on minor gaps rather than aggressive trend-following at extremes.
Overall View:
All three indices — NIFTY, BANKNIFTY, and SENSEX — closed below their respective 12 Aug 2026 Day CPR bands on 11 Aug 2026, with Descending Narrow/Medium CPR configurations confirming that the structural bias for 12 Aug 2026 is bearish unless the CPR bands are reclaimed at the open. BANKNIFTY is the most interesting setup of the three, as prev close (57,446.25) sits above TC (57,425.06) — a Descending Trend Reversal signal — meaning a flat or gap-up open on BANKNIFTY creates a high-probability bull trend day within an otherwise bearish macro setup, making BANKNIFTY the index to watch for divergence from NIFTY and SENSEX. SENSEX adds a unique dimension with its weekly expiry tomorrow (13 Aug 2026) and Week max pain at 78,300 — only 145.75 points above the close — creating strong expiry pinning dynamics that make SENSEX the most range-bound of the three indices regardless of gap direction, while NIFTY's dual OI walls at 24,450 (support) and 24,500 (resistance) in just a 50-point band make it the tightest battlefield of the session.
All three indices — NIFTY, BANKNIFTY, and SENSEX — closed below their respective 12 Aug 2026 Day CPR bands on 11 Aug 2026, with Descending Narrow/Medium CPR configurations confirming that the structural bias for 12 Aug 2026 is bearish unless the CPR bands are reclaimed at the open. BANKNIFTY is the most interesting setup of the three, as prev close (57,446.25) sits above TC (57,425.06) — a Descending Trend Reversal signal — meaning a flat or gap-up open on BANKNIFTY creates a high-probability bull trend day within an otherwise bearish macro setup, making BANKNIFTY the index to watch for divergence from NIFTY and SENSEX. SENSEX adds a unique dimension with its weekly expiry tomorrow (13 Aug 2026) and Week max pain at 78,300 — only 145.75 points above the close — creating strong expiry pinning dynamics that make SENSEX the most range-bound of the three indices regardless of gap direction, while NIFTY's dual OI walls at 24,450 (support) and 24,500 (resistance) in just a 50-point band make it the tightest battlefield of the session.
Disclaimer: KRVFinMart provides educational and informational content relating to financial markets. Articles, research, examples, charts, strategies and tools are provided for educational purposes and should not be interpreted as personalised investment advice or a guarantee of financial performance. Markets involve risk, including possible loss of capital. Past performance does not guarantee future results. KRVFinMart is not a SEBI Registered Investment Adviser or Research Analyst.