Intraday Analysis for 29 Jul 2026
Markets closed marginally lower on 28 Jul 2026, with Nifty at **23,985.35** (-0.04%), BankNifty at **56,755.60** (-0.58%), and Sensex at **76,765.92** (-0.09%), reflecting broad indecision heading into expiry week. India VIX data is unavailable for this session, limiting direct volatility context; however, the extremely tight straddle values on Nifty (14.55 pts) and BankNifty (43.9 pts) signal that options markets are pricing in exceptionally low expected moves, pointing to a compressed, range-bound environment. PCR positioning across indices suggests the market is pinned near max pain zones — Nifty and BankNifty max pain aligns precisely with the OI resistance strikes (24,000 and 56,800 respectively), reinforcing the likelihood of a mean-reverting, non-directional session on 29 Jul 2026.
All three indices are trading below their respective weekly CPR bands (Nifty weekly P=23,879.95, BankNifty weekly P=56,981.92, Sensex weekly TC=76,812.94), confirming a structurally weak weekly posture; with max pain pinning Nifty at 24,000 and BankNifty at 56,800 — both coinciding with OI resistance walls — the dominant intraday theme is range containment with sharp two-way moves around CPR bands.
NIFTY 50
|
NIFTY 50
23,985.35
▼ -10.60 (-0.04%)
|
INDIA VIX
12.56
▼ -0.77%
Low Fear Zone
|
OVERALL PCR
OI0.94
Vol1.06
Neutral Range
|
ATM STRADDLE
Week14.55 pts
Month14.55 pts
|
|
OI SUPPORT (PE)
Week23,950
Month23,950
|
OI RESIST (CE)
Week24,000
Month24,000
|
CPR RELATIONSHIP
DayAscending — Narrow
WeekOverlapping — Wide
MonthOverlapping — Wide
|
MAX PAIN
Week24,000
Month24,000
|
Week expiry: 28-Jul-2026 · Month expiry: 28-Jul-2026
BANK NIFTY
|
BANK NIFTY
56,755.60
▼ -331.60 (-0.58%)
|
INDIA VIX
12.56
▼ -0.77%
Low Fear Zone
|
OVERALL PCR
OI0.65
Vol0.94
Call-heavy — Bearish
|
ATM STRADDLE
Month43.90 pts
|
|
OI SUPPORT (PE)
Month56,700
|
OI RESIST (CE)
Month56,800
|
CPR RELATIONSHIP
DayDescending — Medium
MonthOverlapping — Wide
|
MAX PAIN
Month56,800
|
Month expiry: 28-Jul-2026
SENSEX
|
SENSEX
76,765.92
▼ -69.86 (-0.09%)
|
INDIA VIX
12.56
▼ -0.77%
Low Fear Zone
|
OVERALL PCR
OI1.84
Vol0.98
Put-heavy — Hedging
|
ATM STRADDLE
Week870.00 pts
Month870.00 pts
|
|
OI SUPPORT (PE)
Week75,000
Month75,000
|
OI RESIST (CE)
Week78,500
Month78,500
|
CPR RELATIONSHIP
DayOverlapping — Narrow
WeekOverlapping — Wide
MonthOverlapping — Wide
|
MAX PAIN
Week77,500
Month77,500
|
Week expiry: 30 Jul 2026 · Month expiry: 30 Jul 2026
NIFTY
Ascending — Narrow (0.03%)
▲ Bullish
|
Market Structure
Trending (up or down trend) |
Straddle
ATM 24,000 straddle = **14.55 pts** (Call 0.05 + Put 14.50); implies an expected move of roughly ±14.55 pts from 24,000 — an extraordinarily compressed range signalling near-zero directional expectation from options writers; any sustained move beyond 23,985 or 24,015 becomes a breakout from priced risk. |
Max Pain
Max Pain = **24,000** (both week and month); option sellers’ minimum-loss pin is right at the OI resistance wall — this is the dominant gravitational pull for 29 Jul, meaning intraday rallies toward 24,000 are likely to face stiff CE writing pressure and premiums decay rapidly above this level. |
Tomorrow’s Complete Level Map
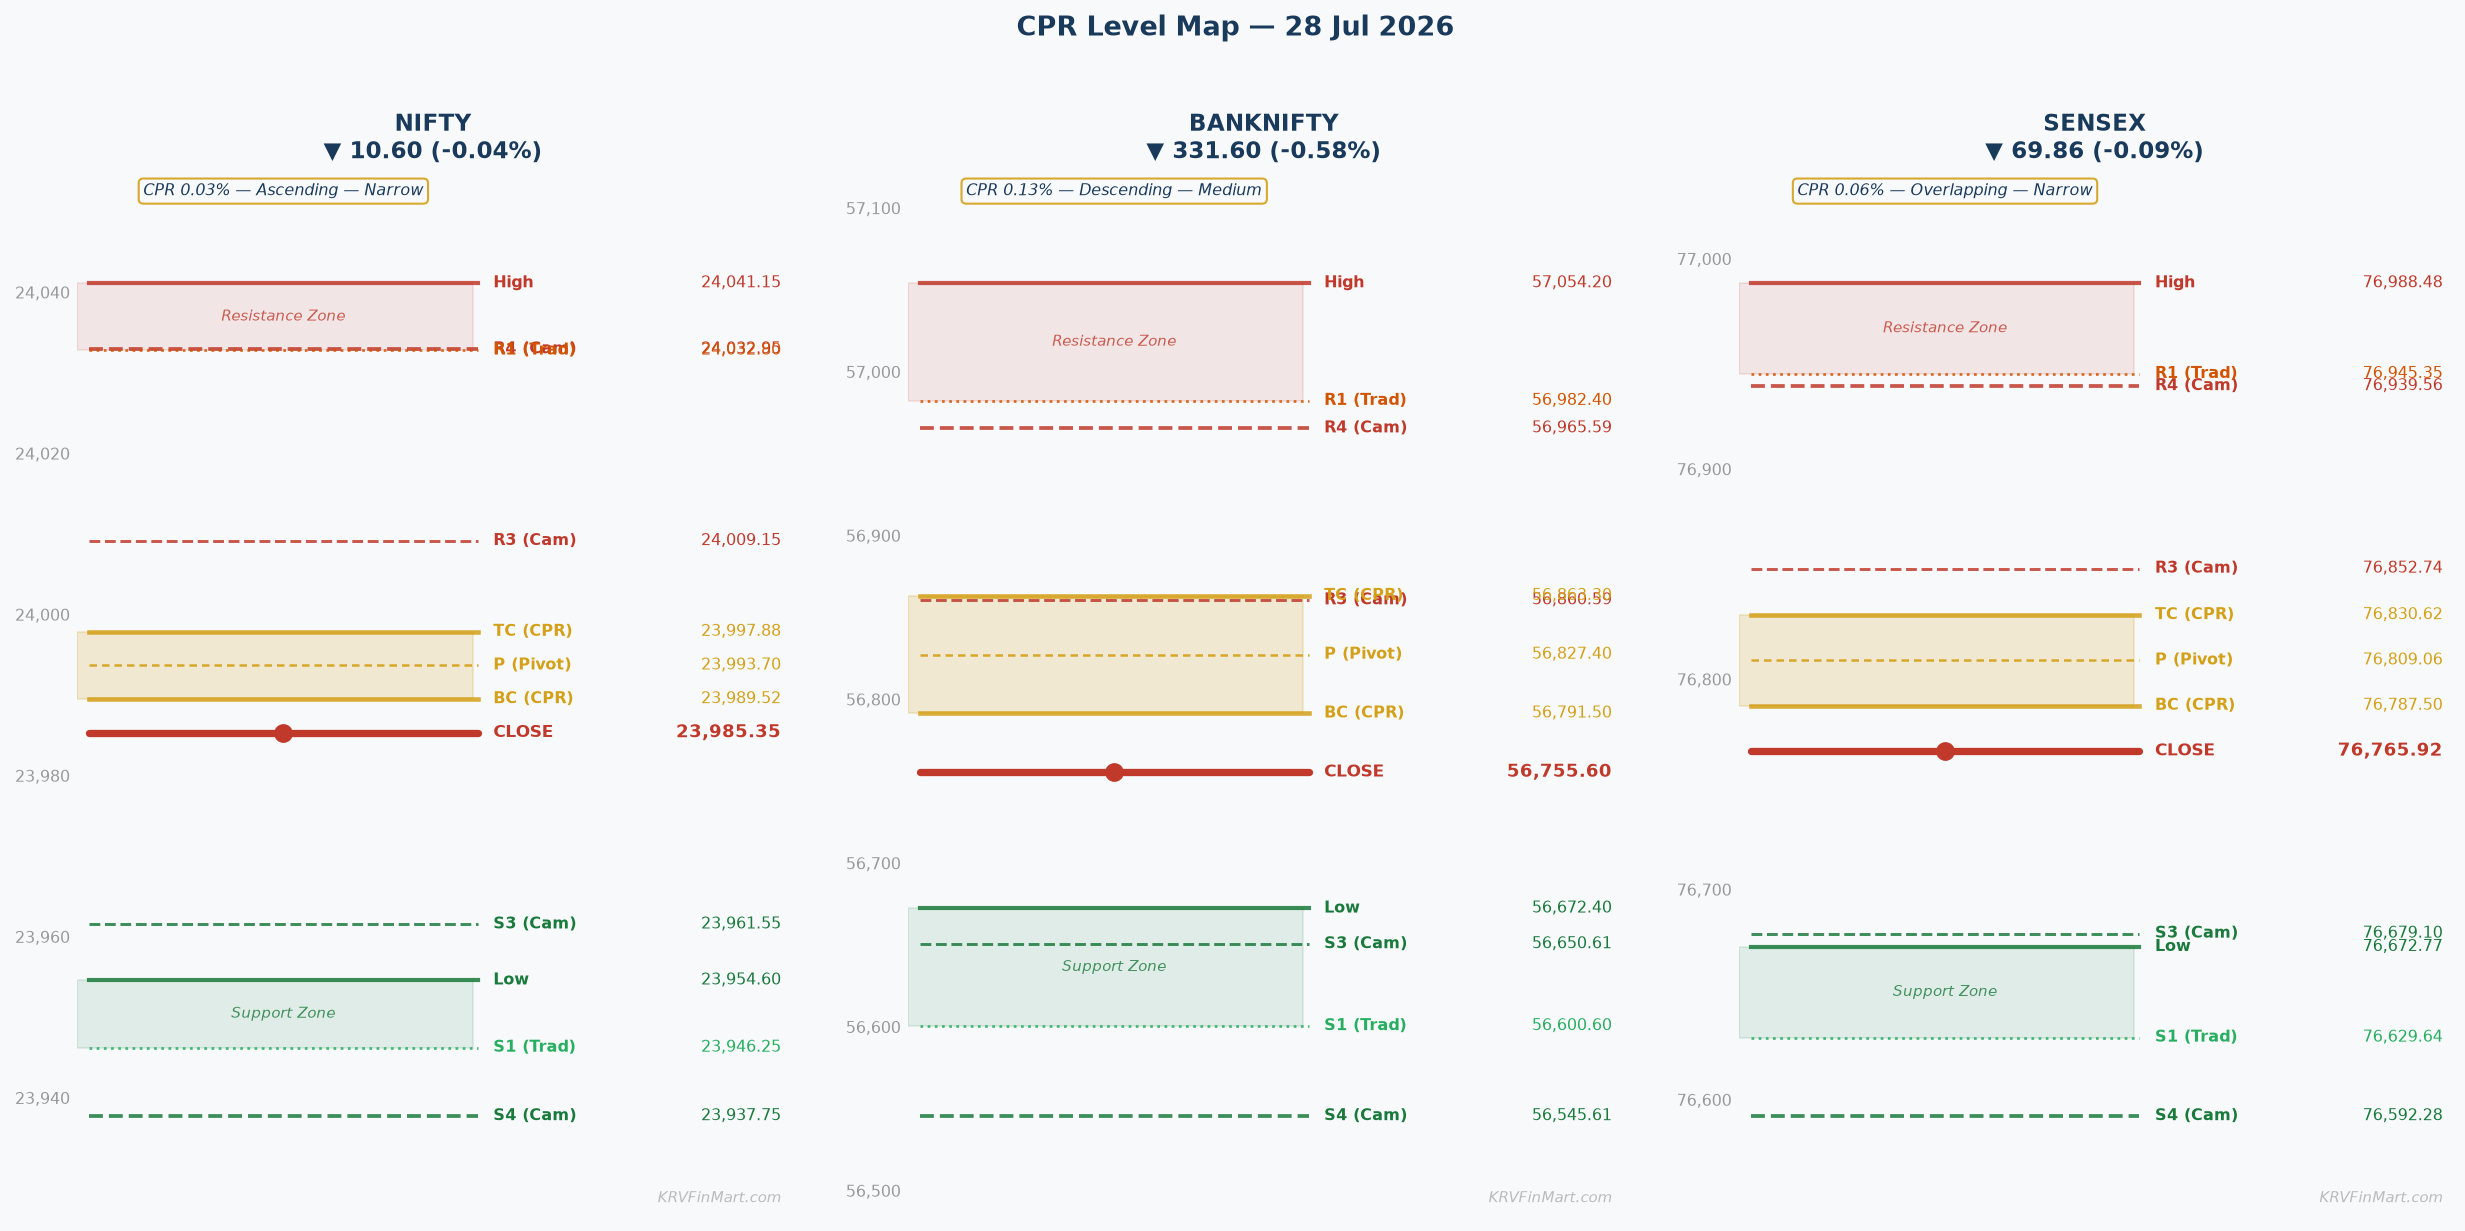
OI-R: 24,000 R3: 24,119.35 H6: 24,072.01 H5: 24,060.75 R2: 24,080.25 H4 ▶: 24,032.95 R1: 24,032.80 PDH: 24,041.15 H3 ↩: 24,009.15
TC: 23,997.88 P: 23,993.70 BC: 23,989.52
L3 ↩: 23,961.55 PDL: 23,954.60 S1: 23,946.25 L4 ▶: 23,937.75 S2: 23,907.15 L5: 23,909.95 L6: 23,898.69 S3: 23,859.70 OI-S: 23,950
↩ = Camarilla reversal point | ▶ = Camarilla breakout/breakdown trigger | OI-R/OI-S = Options wall (CE/PE max OI)
▲ Higher Open (Gap Up) — Open > Prev Close
▲ Bullish
Open lands: Ascending CPR with BC=23,989.52 and TC=23,997.88 sitting above prev close (23,985.35): a gap-up open places price inside the CPR band (between BC 23,989.52 and TC 23,997.88) on a minor gap, or above TC 23,997.88 on a significant/large gap — the entire ascending CPR band is now acting as a launching pad from below.
CPR role: Launch pad / immediate support zone — ascending CPR is now the floor below price on a gap-up; BC=23,989.52 is first intraday support and TC=23,997.88 is the bullish continuation trigger.
Minor Gap (0.05–0.25%) — Structure Dominant
Minor gap (0.05–0.25%): Open lands inside CPR band between BC=23,989.52 and TC=23,997.88. Structure is dominant — ascending narrow CPR acts as the primary bullish cue. Wait for first 15-min candle close above TC=23,997.88 to confirm breakout. On confirmation, H3=24,009.15 is the first Camarilla mean-reversion resistance; above that, R1=24,032.80 and H4=24,032.95 form a clustered zone of traditional and Camarilla breakout resistance. OI-R at 24,000 is the critical CE wall — price must close above it on 15-min candle for any sustained upside.
Significant Gap (0.25–0.5%) — Balanced
Significant gap (0.25–0.5%): Open near or just above TC=23,997.88 or H3=24,009.15. Gap and structure balanced. The OI-R wall at 24,000 and max pain at 24,000 create immediate overhead friction — expect a retest/pause near 24,000 before any extension. If 15-min candle holds above TC=23,997.88 after retest, target H3=24,009.15 then R1=24,032.80/H4=24,032.95 cluster.
Large Gap (>0.5%) — Gap Direction Dominant
Large gap (>0.5%): Open above H3=24,009.15 or higher — gap dominates. Price likely opens near or above R1=24,032.80/H4=24,032.95 cluster. Caution: OI-R at 24,000 and max pain at 24,000 are now below the open — gap-fill risk is real. Watch 15-min candle; if it fails to hold above H3=24,009.15, a gap-fill toward BC=23,989.52 is high probability.
|
▲ Upside Path → OI-R
TC=23,997.88 (CPR top, bullish gate) → OI-R/Max Pain=24,000 (primary CE wall, first stall) → H3=24,009.15 (Camarilla mean-reversion resistance) → R1=24,032.80 / H4=24,032.95 (clustered Traditional + Camarilla breakout trigger, first partial profit) → PDH=24,041.15 (prior day high, psychological resistance) → H5=24,060.75 (Camarilla extended target) → H6=24,072.01 → R2=24,080.25 (second Traditional target). |
▼ Downside Path → OI-S
CPR BC=23,989.52 (first support on pullback) → OI-S=23,950 (PE wall, strong floor) → L3=23,961.55 (Camarilla mean-reversion support) → PDL=23,954.60 (prior day low) → S1=23,946.25 (Traditional first support) → L4=23,937.75 (Camarilla breakdown trigger) → S2=23,907.15 / L5=23,909.95 (clustered downside targets). |
|
🔴 OI-R: OI-R=24,000 is the PRIMARY UPSIDE CEILING — maximum CE open interest strike precisely coinciding with max pain; this is an active options writing wall that will suppress premiums and cap rallies on an intraday basis. Only a 15-min close above 24,000 with expansion in volume signals a genuine breakout toward H3=24,009.15. |
🟢 OI-S: OI-S=23,950 is the PRIMARY DOWNSIDE FLOOR — maximum PE open interest; a bounce zone where put writers defend aggressively. On a gap-up scenario, 23,950 is a distant abort level — only relevant if the rally fails completely and price collapses through L3=23,961.55 and PDL=23,954.60. |
⚡ Key Trigger: Sustain above TC=23,997.88 on first 15-min candle close (Narrow CPR rule). Secondary trigger: 15-min close above H3=24,009.15 for extension. OI-R=24,000 acts as the intraday ceiling until decisively cleared.
▼ Lower Open (Gap Down) — Open < Prev Close
▼ Bearish
Open lands: Ascending CPR has BC=23,989.52 above prev close (23,985.35) — a gap-down open places price below BC=23,989.52, which means price opens below the ENTIRE ascending CPR band. Per the Ascending CPR framework, a gap-down in an ascending CPR structure = compounding weakness: price is below the entire CPR that is itself above yesterday’s price.
CPR role: Overhead resistance / trap door — the entire CPR band (BC=23,989.52 to TC=23,997.88) is now overhead. A gap-down below BC converts the ascending CPR into a supply zone; any bounce toward BC=23,989.52 that fails confirms bearish continuation.
Minor Gap (0.05–0.25%) — Structure Dominant
Minor gap (0.05–0.25%): Open slightly below prev close (~23,970–23,985). Price is below BC=23,989.52. Structure is dominant — ascending narrow CPR now overhead acts as resistance. Watch first 15-min candle: if it reclaims and closes above BC=23,989.52, bullish recovery toward TC=23,997.88 and OI-R=24,000. If 15-min candle fails to reclaim BC, short bias activates with target L3=23,961.55 then OI-S=23,950.
Significant Gap (0.25–0.5%) — Balanced
Significant gap (0.25–0.5%): Open near 23,925–23,985. Gap and structure balanced — both confirm bearish pressure. CPR band is distant overhead resistance. L3=23,961.55 is first Camarilla mean-reversion support; PDL=23,954.60 is key prior-day floor. OI-S=23,950 is the dominant PE wall — high probability of a test here. If OI-S=23,950 holds on first touch (watch 15-min candle), a mean-reversion bounce toward L3=23,961.55 then BC=23,989.52 is possible.
Large Gap (>0.5%) — Gap Direction Dominant
Large gap (>0.5%): Open below L3=23,961.55 or near OI-S=23,950 — gap dominates. Direct test of OI-S=23,950 at open. If OI-S fails on 15-min candle close, S1=23,946.25 and L4=23,937.75 are next targets. CPR band is too far overhead to be relevant for recovery unless gap fills completely.
|
▲ Upside Path → OI-R
Recovery path: L3=23,961.55 (Camarilla mean-reversion, bounce reference) → BC=23,989.52 (CPR bottom, key recovery gate) → P=23,993.70 (pivot) → TC=23,997.88 (CPR top) → OI-R=24,000 (primary CE wall). |
▼ Downside Path → OI-S
L3=23,961.55 (first Camarilla support, stall/reversal reference) → PDL=23,954.60 (prior day low, key floor) → OI-S=23,950 (PE wall, primary downside target) → S1=23,946.25 (Traditional first support) → L4=23,937.75 (Camarilla breakdown trigger) → S2=23,907.15 / L5=23,909.95 (secondary targets). |
|
🔴 OI-R: OI-R=24,000 is a DISTANT RECOVERY CEILING on gap-down — relevant only if full gap-fill occurs; CE writers at 24,000 will remain active sellers on any bounce. Not a near-term target in a significant/large gap-down scenario. |
🟢 OI-S: OI-S=23,950 is the PRIMARY DOWNSIDE TARGET and FLOOR — the dominant PE strike where put writers defend maximum positions. A gap-down tests this level directly; a 15-min close below 23,950 signals put writers being overwhelmed and accelerates toward S1=23,946.25/L4=23,937.75. |
⚡ Key Trigger: Reclaim BC=23,989.52 on first 15-min candle close for recovery bias (Narrow CPR rule). Failure at BC=23,989.52 after any bounce = short trigger targeting OI-S=23,950. Break below OI-S=23,950 on 15-min close = accelerated downside toward S1=23,946.25 / L4=23,937.75.
◆ Near Flat Open — Open ≈ Prev Close (±0.05%)
◆ Neutral
Open lands: Ascending CPR: BC=23,989.52 is above prev close (23,985.35) by ~4 pts. A flat open (±0.05% = ±12 pts) places price between ~23,973 and ~23,997 — most likely just below BC=23,989.52. Per the Ascending CPR flat-open rule: flat open = near prev close = at or near BC, meaning CPR acts as support above the open.
CPR role: Support above / decision zone — the ascending narrow CPR band (BC=23,989.52 to TC=23,997.88) is just above the flat open. Price must work upward to reach it. CPR is the bullish trigger zone: clearing BC=23,989.52 and TC=23,997.88 on 15-min candle confirms the ascending trend. Failure to reach CPR = sideways drift toward OI-S=23,950.
Near Flat (±0.05%)
CPR structure is the ONLY signal on a flat open. The ascending narrow CPR (0.03% width) just above the flat open creates a classic ‘reach-up-or-drift-down’ setup. Zero gap signal — no gap confirmation. The 14.55-pt straddle implies market makers expect minimal movement. Watch the first 15-min candle: if price pushes above BC=23,989.52 and closes above TC=23,997.88, the ascending structure triggers a bullish trending day targeting OI-R=24,000 (CE wall) then H3=24,009.15. If the first 15-min candle fails to reach BC=23,989.52 and closes below ~23,980, downside drift toward L3=23,961.55 and OI-S=23,950 becomes the dominant path. The narrow CPR means the first 15-min direction is decisive — no second chances typical of wide CPR sessions. Max pain at 24,000 and OI-R at 24,000 act as a gravitational magnet pulling price upward but capping it sharply at the same level — a classic expiry-week pin scenario.
|
▲ Upside Path → OI-R
BC=23,989.52 (CPR bottom, first bullish gate) → P=23,993.70 (pivot) → TC=23,997.88 (CPR top, bullish confirmation) → OI-R=24,000 / Max Pain=24,000 (primary ceiling, CE wall) → H3=24,009.15 (Camarilla mean-reversion resistance, first partial profit) → R1=24,032.80 / H4=24,032.95 (clustered breakout zone). |
▼ Downside Path → OI-S
L3=23,961.55 (Camarilla mean-reversion support, first stall) → PDL=23,954.60 (prior day low) → OI-S=23,950 (PE wall, primary downside floor, scalp target) → S1=23,946.25 (Traditional first support) → L4=23,937.75 (Camarilla breakdown trigger). |
|
🔴 OI-R: OI-R=24,000 is the MAXIMUM PAIN PIN and PRIMARY CE WALL — on a flat open this is the magnet and ceiling simultaneously; price will be pulled toward it but likely stall and reverse here on first touch. Only a 15-min close with volume confirmation above 24,000 signals genuine breakout. |
🟢 OI-S: OI-S=23,950 is the PE WALL FLOOR — on a flat open, this is the key downside abort zone for bulls and the scalp target for bears. A test of 23,950 with a 15-min bounce is a high-probability mean-reversion long entry back toward the CPR band. |
⚡ Key Trigger: First 15-min candle close above TC=23,997.88 = bullish confirmation (Narrow CPR rule); target OI-R=24,000 then H3=24,009.15. First 15-min close below BC=23,989.52 without recovery = bearish drift; target L3=23,961.55 then OI-S=23,950.
BANKNIFTY
Descending — Medium (0.13%)
▼ Bearish
|
Market Structure
Balanced or transitional |
Straddle
ATM 56,800 straddle = **43.9 pts** (Call 0.05 + Put 43.85); implies an expected intraday move of roughly ±43.9 pts from 56,800 — a very narrow range expectation signalling extreme compression at the ATM strike; the near-zero call premium suggests the market is pricing negligible probability of a sustained move above 56,800. |
Max Pain
Max Pain = **56,800** (month); coincides exactly with OI resistance (CE max OI at 56,800) and is above yesterday’s close of 56,755.60 — max pain acts as a gravitational upside target, but CE writing pressure at 56,800 is maximum, making it a ceiling and a pin zone simultaneously. |
Tomorrow’s Complete Level Map
OI-R: 56,800 R3: 57,364.20 H6: 57,137.96 H5: 57,088.23 R2: 57,209.20 H4 ▶: 56,965.59 R1: 56,982.40 PDH: 57,054.20 H3 ↩: 56,860.59
TC: 56,863.30 P: 56,827.40 BC: 56,791.50
L3 ↩: 56,650.61 PDL: 56,672.40 S1: 56,600.60 L4 ▶: 56,545.61 S2: 56,445.60 L5: 56,422.97 L6: 56,373.24 S3: 56,218.80 OI-S: 56,700
↩ = Camarilla reversal point | ▶ = Camarilla breakout/breakdown trigger | OI-R/OI-S = Options wall (CE/PE max OI)
▲ Higher Open (Gap Up) — Open > Prev Close
↕ Conflicted
Open lands: Descending CPR: TC=56,863.30 < prev BC (derived: yesterday's BC would have been above TC). A gap-up open above prev close (56,755.60) places price inside the descending CPR band (between BC=56,791.50 and TC=56,863.30) on a minor gap, or above TC=56,863.30 on a significant/large gap. Per Descending CPR gap-up rule: open above TC = above the entire descending CPR — confirms hidden strength against the descending structure.
CPR role: Support below / potential launchpad — on a gap-up in a descending CPR, the band (BC=56,791.50–TC=56,863.30) shifts to intraday support if price opens above TC=56,863.30. If open is inside the band, CPR remains a decision zone.
Minor Gap (0.05–0.25%) — Structure Dominant
Minor gap (0.05–0.25%): Open inside CPR band (~56,784–56,898). Structure dominant (descending = bearish lean) but gap provides a bullish counter-signal. Descending medium CPR requires first 30-min close for confirmation. If 30-min close holds above P=56,827.40, bullish recovery toward TC=56,863.30 / H3=56,860.59 then OI-R=56,800 (already below — see note). If 30-min close fails below BC=56,791.50, descending bias resumes toward OI-S=56,700.
Significant Gap (0.25–0.5%) — Balanced
Significant gap (0.25–0.5%): Open near or above TC=56,863.30 / H3=56,860.59. Gap and structure balanced — gap is bullish against descending CPR. 30-min close above TC=56,863.30 = bullish override; target H4=56,965.59 then R1=56,982.40. Note: OI-R=56,800 is BELOW TC, meaning the CE wall is already below any gap-up open — gap-up opens are above the primary OI ceiling.
Large Gap (>0.5%) — Gap Direction Dominant
Large gap (>0.5%): Open above H3=56,860.59 or near H4=56,965.59 — gap dominates; descending CPR structure overridden. However, descending CPR and balanced market structure suggest gap-fill risk is high. Watch 30-min candle; fade opportunity if price reverses below TC=56,863.30 / H3=56,860.59.
|
▲ Upside Path → OI-R
TC=56,863.30 / H3=56,860.59 (CPR top + Camarilla mean-reversion, clustered resistance/trigger) → PDH=57,054.20 (prior day high) → H4=56,965.59 (Camarilla breakout trigger, first partial profit) → R1=56,982.40 (Traditional first target) → H5=57,088.23 (Camarilla upside target) → H6=57,137.96 → R2=57,209.20. |
▼ Downside Path → OI-S
BC=56,791.50 (CPR bottom, key support) → OI-R=56,800 (note: OI resistance is between BC and open on gap-up — now acts as mild support ledge) → OI-S=56,700 (PE wall, primary floor) → L3=56,650.61 (Camarilla mean-reversion support) → PDL=56,672.40 (prior day low) → S1=56,600.60. |
|
🔴 OI-R: OI-R=56,800 is BELOW the gap-up open in this scenario — it transitions from ceiling to a support ledge within the CPR band. The CE wall at 56,800 now acts as an intraday floor on a gap-up; a close below 56,800 on 30-min candle signals reversal. |
🟢 OI-S: OI-S=56,700 is a DISTANT FLOOR on a gap-up — the PE wall where put writers are positioned. Only relevant if the gap-up fails completely and price collapses through BC=56,791.50 and L3=56,650.61. |
⚡ Key Trigger: 30-min close above TC=56,863.30 / H3=56,860.59 for bullish continuation (Medium CPR rule — first 30-min close required). 30-min close below BC=56,791.50 after gap-up = bearish trap/fade signal. Retests expected in medium CPR sessions.
▼ Lower Open (Gap Down) — Open < Prev Close
▼ Bearish
Open lands: Descending CPR: TC=56,863.30 < prev BC. A gap-down open below prev close (56,755.60) places price below BC=56,791.50 — i.e., inside the CPR band (if open is between BC=56,791.50 and TC=56,863.30 is impossible on gap-down from 56,755.60 since BC is above prev close). Actual position: gap-down from 56,755.60 opens below BC=56,791.50, which is below the entire descending CPR band. Per Descending CPR gap-down rule: open inside CPR or below BC = aligned with descending structure — compounding bearish signal.
CPR role: Overhead resistance — entire CPR band (BC=56,791.50 to TC=56,863.30) is overhead. Descending CPR acting as a supply zone above the open. Any bounce toward BC=56,791.50 that fails on 30-min close confirms bearish continuation.
Minor Gap (0.05–0.25%) — Structure Dominant
Minor gap (0.05–0.25%): Open slightly below prev close (~56,670–56,755). Price below BC=56,791.50. Descending structure dominant — bear bias confirmed. First 30-min close below BC=56,791.50 = short trigger. Target OI-S=56,700 (PE wall, primary downside floor) then L3=56,650.61. If 30-min close reclaims BC=56,791.50, neutral/recovery watch toward P=56,827.40.
Significant Gap (0.25–0.5%) — Balanced
Significant gap (0.25–0.5%): Open near 56,614–56,755. Both gap and descending structure aligned — high bearish conviction. OI-S=56,700 is the immediate first target. L3=56,650.61 just below 56,700 is the Camarilla mean-reversion support. 30-min close below OI-S=56,700 triggers L4=56,545.61 and S1=56,600.60 targets.
Large Gap (>0.5%) — Gap Direction Dominant
Large gap (>0.5%): Open below L3=56,650.61 or near OI-S=56,700 — gap dominates. Direct test of OI-S=56,700 / PDL=56,672.40 at open. 30-min close below OI-S=56,700 accelerates toward S1=56,600.60 / L4=56,545.61 / S2=56,445.60.
|
▲ Upside Path → OI-R
Recovery path: OI-R=56,800 (ceiling within CPR, primary CE wall) → BC=56,791.50 (CPR bottom, recovery gate) → P=56,827.40 (pivot, second partial zone) → TC=56,863.30 / H3=56,860.59 (CPR top + Camarilla resistance, full recovery only above here). |
▼ Downside Path → OI-S
OI-S=56,700 (PE wall, primary downside target and floor) → PDL=56,672.40 (prior day low) → L3=56,650.61 (Camarilla mean-reversion support, stall zone) → S1=56,600.60 (Traditional first support, first partial profit) → L4=56,545.61 (Camarilla breakdown trigger) → S2=56,445.60 / L5=56,422.97 (secondary targets). |
|
🔴 OI-R: OI-R=56,800 is a MID-CPR CEILING on gap-down — sits between BC=56,791.50 and open; CE writing pressure at 56,800 caps any bounce within the CPR band. A 30-min close above 56,800 would signal recovery toward TC=56,863.30. |
🟢 OI-S: OI-S=56,700 is the PRIMARY DOWNSIDE TARGET — the PE max OI strike where put writers are positioned. On a gap-down in descending CPR, this is the first profit-booking zone for shorts and a potential bounce level for aggressive counter-trend longs. |
⚡ Key Trigger: 30-min close below BC=56,791.50 confirms bearish continuation (Medium CPR rule). Failure at BC=56,791.50 on any bounce = short entry. Break below OI-S=56,700 on 30-min close = next leg toward L4=56,545.61 / S1=56,600.60. Recovery trigger: 30-min close above BC=56,791.50 for long scalp toward P=56,827.40.
◆ Near Flat Open — Open ≈ Prev Close (±0.05%)
▼ Bearish
Open lands: Descending CPR: TC=56,863.30 is above prev close (56,755.60) and BC=56,791.50 is also above prev close. A flat open (±0.05% = ±28 pts) places price between ~56,727 and ~56,784 — below BC=56,791.50. Per the Descending CPR flat-open rule: flat open = near prev close = at or near TC; however here BC is also above prev close, so flat open is below the ENTIRE descending CPR band — CPR acts as overhead resistance.
CPR role: Overhead resistance / decision zone — both BC=56,791.50 and TC=56,863.30 are above a flat open; the descending CPR band is entirely above. This is a bearish structural position: price must fight upward through BC=56,791.50 first, then P=56,827.40, then TC=56,863.30/H3=56,860.59 to turn bullish.
Near Flat (±0.05%)
CPR structure is the dominant signal on flat open (zero gap). Descending medium CPR above the open creates classic overhead supply — the CPR band (BC=56,791.50–TC=56,863.30) is entirely above price. Balanced/transitional market structure adds indecision but the descending CPR is the primary directional cue. OI-R=56,800 sits just above BC=56,791.50 — this means the CE wall and CPR bottom are clustered within ~8.50 pts of each other, creating a dense supply zone between 56,791.50 and 56,800. The 43.9-pt straddle implies price will oscillate within a tight range. Watch the first 30-min candle: if price attempts BC=56,791.50 and fails on 30-min close, short trigger activates targeting OI-S=56,700 then L3=56,650.61 / PDL=56,672.40. If 30-min close clears BC=56,791.50 and then OI-R=56,800, recovery toward P=56,827.40 and TC=56,863.30/H3=56,860.59 is possible — but requires two 30-min closes above BC for medium CPR. Max pain at 56,800 acts as a gravitational pull — flat-open price may drift toward 56,800 during the session before sellers re-engage.
|
▲ Upside Path → OI-R
BC=56,791.50 (CPR bottom, first recovery gate) → OI-R=56,800 (CE wall, clustered with BC, primary supply zone) → P=56,827.40 (pivot, secondary target) → TC=56,863.30 / H3=56,860.59 (CPR top + Camarilla resistance, full recovery confirmation) → H4=56,965.59 (Camarilla breakout trigger) → R1=56,982.40. |
▼ Downside Path → OI-S
OI-S=56,700 (PE wall, primary downside floor and first target for bears) → PDL=56,672.40 (prior day low, psychological support) → L3=56,650.61 (Camarilla mean-reversion support) → S1=56,600.60 (Traditional first support, partial profit) → L4=56,545.61 (Camarilla breakdown trigger). |
|
🔴 OI-R: OI-R=56,800 is the PRIMARY CE WALL and MAX PAIN PIN — on a flat open, this is both the ceiling and the gravitational attractor. Price will be pulled toward 56,800 by max pain dynamics but face maximum CE writing pressure there. A sustained 30-min close above 56,800 is required to confirm any bullish reversal. |
🟢 OI-S: OI-S=56,700 is the PE WALL FLOOR and PRIMARY DOWNSIDE TARGET — on a flat open with descending CPR overhead, 56,700 is the natural drift target for intraday bears. A bounce from 56,700 is high-probability on first touch given put writer positioning. |
⚡ Key Trigger: 30-min close above BC=56,791.50 = first recovery sign; second 30-min close above OI-R=56,800 = bullish toward P=56,827.40 (Medium CPR rule — retests expected, two 30-min closes for conviction). 30-min close below OI-S=56,700 = bearish acceleration toward L3=56,650.61 / S1=56,600.60.
SENSEX
Overlapping — Narrow (0.06%)
◆ Neutral
|
Market Structure
Trending (up or down trend) |
Straddle
ATM 76,800 straddle = **870.0 pts** (Call 836.45 + Put 33.55); this is a far larger straddle than Nifty/BankNifty in absolute terms but reflects Sensex’s higher absolute level; the extreme skew (Call LTP 836.45 vs Put LTP 33.55) suggests the 76,800 CE is deep in the money or there is a massive mispricing — the dominant interpretation is that the put side is pricing near-zero downside risk while the call side reflects intrinsic value, implying price is significantly below the ATM strike in effective terms. |
Max Pain
Max Pain = **77,500** (both week and month, expiry 30 Jul 2026); Sensex closed at 76,765.92 — max pain is **734.08 pts above** yesterday’s close, indicating a significant gravitational pull upward toward 77,500 heading into expiry; this is a bullish max-pain implication for Sensex on 29 Jul. |
Tomorrow’s Complete Level Map
OI-R: 78,500 R3: 77,261.06 H6: 77,082.01 H5: 77,040.97 R2: 77,124.77 H4 ▶: 76,939.56 R1: 76,945.35 PDH: 76,988.48 H3 ↩: 76,852.74
TC: 76,830.62 P: 76,809.06 BC: 76,787.50
L3 ↩: 76,679.10 PDL: 76,672.77 S1: 76,629.64 L4 ▶: 76,592.28 S2: 76,493.35 L5: 76,490.87 L6: 76,449.83 S3: 76,313.93 OI-S: 75,000
↩ = Camarilla reversal point | ▶ = Camarilla breakout/breakdown trigger | OI-R/OI-S = Options wall (CE/PE max OI)
▲ Higher Open (Gap Up) — Open > Prev Close
▲ Bullish
Open lands: Overlapping Narrow CPR: BC=76,787.50 and TC=76,830.62 with prev close=76,765.92. BC is ~21.58 pts above prev close. A gap-up open places price above prev close (~76,766+): a minor gap-up opens inside the CPR band (between BC=76,787.50 and TC=76,830.62); a significant/large gap opens above TC=76,830.62.
CPR role: Launch pad / support — overlapping narrow CPR on a gap-up means price enters or clears the band immediately; trending market structure (Sensex) amplifies the breakout potential above TC=76,830.62.
Minor Gap (0.05–0.25%) — Structure Dominant
Minor gap (0.05–0.25%): Open inside CPR band (~76,804–76,957). Structure dominant (trending + overlapping narrow = energy compression release). First 15-min candle close above TC=76,830.62 = bullish confirmation. Target H3=76,852.74 (Camarilla mean-reversion, first stall) then R1=76,945.35 / H4=76,939.56 (clustered Traditional and Camarilla breakout zone). Max pain at 77,500 acts as the session’s magnetic north — pull toward it is strong. OI-R=78,500 is distant but represents the true upside ceiling.
Significant Gap (0.25–0.5%) — Balanced
Significant gap (0.25–0.5%): Open above TC=76,830.62 near H3=76,852.74. Gap and structure balanced — both bullish. 15-min close above H3=76,852.74 confirms extension toward R1=76,945.35 / H4=76,939.56. PDH=76,988.48 is key prior-day resistance before R2=77,124.77 and max pain zone at 77,500.
Large Gap (>0.5%) — Gap Direction Dominant
Large gap (>0.5%): Open above H3=76,852.74 or near H4=76,939.56 — gap dominates. Trending structure (Sensex) supports continuation; however, watch for exhaustion near PDH=76,988.48 and R1=76,945.35. If 15-min candle holds above H3=76,852.74 after any retest, target R2=77,124.77 then H5=77,040.97 zone.
|
▲ Upside Path → OI-R
TC=76,830.62 (CPR top, bullish gate) → H3=76,852.74 (Camarilla mean-reversion resistance, first stall, first partial profit) → H4=76,939.56 / R1=76,945.35 (clustered Camarilla breakout + Traditional first target) → PDH=76,988.48 (prior day high) → H5=77,040.97 (Camarilla extended target) → H6=77,082.01 → R2=77,124.77 (Traditional second target) → R3=77,261.06 → Max Pain=77,500 (expiry gravitational pull) → OI-R=78,500 (PRIMARY CE CEILING, ultimate upside target). |
▼ Downside Path → OI-S
BC=76,787.50 (CPR bottom, first support on pullback) → prev close=76,765.92 → L3=76,679.10 (Camarilla mean-reversion support) → PDL=76,672.77 (prior day low) → S1=76,629.64 (Traditional first support) → L4=76,592.28 (Camarilla breakdown trigger) → OI-S=75,000 (PE wall, very distant floor). |
|
🔴 OI-R: OI-R=78,500 is the DISTANT PRIMARY CE CEILING — far above current price; not an intraday target but the ultimate options wall. For 29 Jul, the effective session ceiling is max pain at 77,500 and PDH=76,988.48 as intermediate caps. |
🟢 OI-S: OI-S=75,000 is a VERY DISTANT PE FLOOR — the PE max OI strike is ~1,766 pts below close, making it irrelevant for intraday risk on a gap-up scenario; serves as the macro downside anchor. |
⚡ Key Trigger: 15-min candle close above TC=76,830.62 for bullish continuation (Narrow CPR rule). Secondary trigger: 15-min close above H3=76,852.74 for extension to R1=76,945.35 / H4=76,939.56. Max pain pull toward 77,500 adds tailwind for any sustained gap-up.
▼ Lower Open (Gap Down) — Open < Prev Close
▼ Bearish
Open lands: Overlapping Narrow CPR: BC=76,787.50 is above prev close=76,765.92 by ~21.58 pts. A gap-down open (below 76,765.92) places price below BC=76,787.50 and below the ENTIRE CPR band. Overlapping CPR below the open = CPR band overhead as resistance. Trending market structure (Sensex) means the directional bias — if already in downtrend — would be confirmed by a gap-down.
CPR role: Overhead resistance — entire narrow CPR band (BC=76,787.50 to TC=76,830.62) is above the gap-down open. Any bounce toward BC=76,787.50 that fails on 15-min close confirms bearish continuation.
Minor Gap (0.05–0.25%) — Structure Dominant
Minor gap (0.05–0.25%): Open slightly below prev close (~76,728–76,766). Price below BC=76,787.50. Structure dominant (trending — if trending down, gap down confirms). 15-min candle: if close below BC=76,787.50, short trigger with target L3=76,679.10 then PDL=76,672.77 and S1=76,629.64. If 15-min close reclaims BC=76,787.50, watch for recovery toward P=76,809.06 and TC=76,830.62.
Significant Gap (0.25–0.5%) — Balanced
Significant gap (0.25–0.5%): Open near 76,573–76,766. Gap and structure balanced — both bearish. L3=76,679.10 and PDL=76,672.77 are immediate downside targets. S1=76,629.64 and L4=76,592.28 are next. OI-S=75,000 is the macro floor but too distant for intraday relevance.
Large Gap (>0.5%) — Gap Direction Dominant
Large gap (>0.5%): Open below L3=76,679.10 or near S1=76,629.64 — gap dominates. CPR band is too far overhead. Target L4=76,592.28 then S2=76,493.35 / L5=76,490.87 (clustered Traditional + Camarilla secondary targets).
|
▲ Upside Path → OI-R
Recovery path: BC=76,787.50 (CPR bottom, recovery gate) → P=76,809.06 (pivot) → TC=76,830.62 (CPR top, full recovery confirmation) → H3=76,852.74 (Camarilla resistance, first partial profit) → PDH=76,988.48 → Max Pain=77,500. |
▼ Downside Path → OI-S
L3=76,679.10 (Camarilla mean-reversion support, first stall) → PDL=76,672.77 (prior day low, key floor) → S1=76,629.64 (Traditional first support, first partial profit) → L4=76,592.28 (Camarilla breakdown trigger) → S2=76,493.35 / L5=76,490.87 (clustered secondary downside targets) → L6=76,449.83 → S3=76,313.93. |
|
🔴 OI-R: OI-R=78,500 is a VERY DISTANT CEILING on gap-down — completely irrelevant for intraday risk. The practical upside cap on a recovery from gap-down is CPR TC=76,830.62 and H3=76,852.74. |
🟢 OI-S: OI-S=75,000 is the MACRO PE FLOOR — over 1,700 pts below close, this is a long-term structural support, not an intraday target. Intraday downside is bounded by S2=76,493.35 / L5=76,490.87 in a significant gap-down scenario. |
⚡ Key Trigger: 15-min close below BC=76,787.50 = bearish confirmation (Narrow CPR rule). Bounce failure at BC=76,787.50 = short trigger. Recovery: 15-min close above BC=76,787.50 then TC=76,830.62 for long scalp.
◆ Near Flat Open — Open ≈ Prev Close (±0.05%)
◆ Neutral
Open lands: Overlapping Narrow CPR: BC=76,787.50 is above prev close (76,765.92) by ~21.58 pts, TC=76,830.62 is above by ~64.70 pts. A flat open (±0.05% = ±38 pts) places price between ~76,728 and ~76,804 — most likely below BC=76,787.50 (since prev close was 76,765.92 and BC is 21.58 pts higher). Flat open = below BC = below entire CPR band. Overlapping (partial overlap with yesterday’s range) means CPR partially reflects prior session.
CPR role: Overhead decision zone — BC=76,787.50 and TC=76,830.62 are both above a flat open. The narrow overlapping CPR creates an energy compression zone just overhead. Trending market structure means once direction is confirmed via first 15-min candle, it tends to be sustained.
Near Flat (±0.05%)
CPR is the only signal on flat open. Overlapping Narrow CPR (0.06%) with BC=76,787.50 just above the flat open creates a ‘reach-up-or-drift-down’ setup identical in character to Nifty, but amplified by Sensex’s max pain pull toward 77,500 — which is 734 pts above close. The trending market structure (Sensex day) means the first 15-min directional candle is the definitive session signal. Watch: if price lifts to test BC=76,787.50 and 15-min candle closes above it, bullish trending day targets TC=76,830.62 then H3=76,852.74 and the max-pain gravitational pull toward 77,500 adds significant momentum. If the 15-min candle fails to reach BC=76,787.50 and closes below ~76,728, downside drift toward L3=76,679.10 / PDL=76,672.77 activates. The 870-pt straddle skew (Call=836.45, Put=33.55) reveals the ATM call has substantial intrinsic value — this is not a normal at-the-money setup; the effective market price is well below 76,800 in options terms, suggesting puts are near worthless. Key implication: downside options protection is cheap, upside is expensive — aligns with max pain pull toward 77,500.
|
▲ Upside Path → OI-R
BC=76,787.50 (CPR bottom, first bullish gate) → P=76,809.06 (pivot) → TC=76,830.62 (CPR top, bullish confirmation) → H3=76,852.74 (Camarilla mean-reversion, first partial profit) → H4=76,939.56 / R1=76,945.35 (clustered breakout + Traditional target) → PDH=76,988.48 (prior day high) → H5=77,040.97 → R2=77,124.77 → R3=77,261.06 → Max Pain=77,500 (expiry gravitational pull). |
▼ Downside Path → OI-S
L3=76,679.10 (Camarilla mean-reversion support) → PDL=76,672.77 (prior day low, first key floor) → S1=76,629.64 (Traditional first support, partial profit for bears) → L4=76,592.28 (Camarilla breakdown trigger) → S2=76,493.35 / L5=76,490.87 (clustered secondary downside, abort zone for bulls). |
|
🔴 OI-R: OI-R=78,500 is the ULTIMATE SESSION CEILING but too distant for intraday targeting on a flat open; max pain at 77,500 is the practical gravitational target for Sensex expiry. A move toward 77,500 would require sustained 15-min closes above multiple resistance clusters. |
🟢 OI-S: OI-S=75,000 is a MACRO PE ANCHOR — approximately 1,766 pts below close; completely irrelevant for intraday risk on a flat open. The practical intraday support floor is S1=76,629.64 and L4=76,592.28. |
⚡ Key Trigger: 15-min candle close above BC=76,787.50 = bullish confirmation; target TC=76,830.62 then H3=76,852.74 (Narrow CPR rule). 15-min close above TC=76,830.62 = extension toward R1=76,945.35 / H4=76,939.56. 15-min close below PDL=76,672.77 after failing BC = bearish trigger toward S1=76,629.64 / L4=76,592.28.
📊 VIX Insight: India VIX data is unavailable for 28 Jul 2026, limiting direct volatility regime assessment. However, the straddle pricing provides a proxy: Nifty ATM straddle at just **14.55 pts** and BankNifty at **43.9 pts** reflect near-record low implied volatility expectations, consistent with a VIX at suppressed levels (likely sub-12 range). Sensex’s 870-pt straddle skew (Call 836.45 / Put 33.55) suggests deep-ITM call pricing rather than elevated volatility — the effective implied move for Sensex is minimal. In this low-volatility, expiry-week context, traders should expect mean-reverting behaviour, rapid premium decay, and sharp but brief directional spikes. Option selling strategies (short straddles near 24,000 for Nifty, near 56,800 for BankNifty) are favoured by the data, while buyers face severe theta headwinds. If VIX spikes on any opening gap tomorrow, reassess breakout levels immediately as the low-IV assumption would be invalidated.
Overall View:
Heading into 29 Jul 2026, all three indices are pinned near max pain zones with OI walls creating dual-sided suppression: Nifty between OI-S=23,950 and OI-R=24,000 (a mere 50-pt corridor), BankNifty between OI-S=56,700 and OI-R=56,800 (100-pt corridor), while Sensex faces a bullish max pain pull toward 77,500 — 734 pts above its close — with OI boundaries far wider. The dominant session theme is **expiry-week pin and mean-reversion** for Nifty and BankNifty; for Sensex, the max pain imbalance creates a genuine bullish directional bias if opening strength is confirmed above TC=76,830.62. Traders should treat the first 15-min candle (Nifty/Sensex — Narrow CPR) and first 30-min candle (BankNifty — Medium CPR) as the session’s only directional oracle — in all three cases, the opening gap relative to CPR bands will determine whether the session is a trending pin toward max pain or a sharp break below OI support floors.
This analysis is for educational purposes only and is not investment advice.


Responses