
Intraday Analysis for 06 Aug 2026

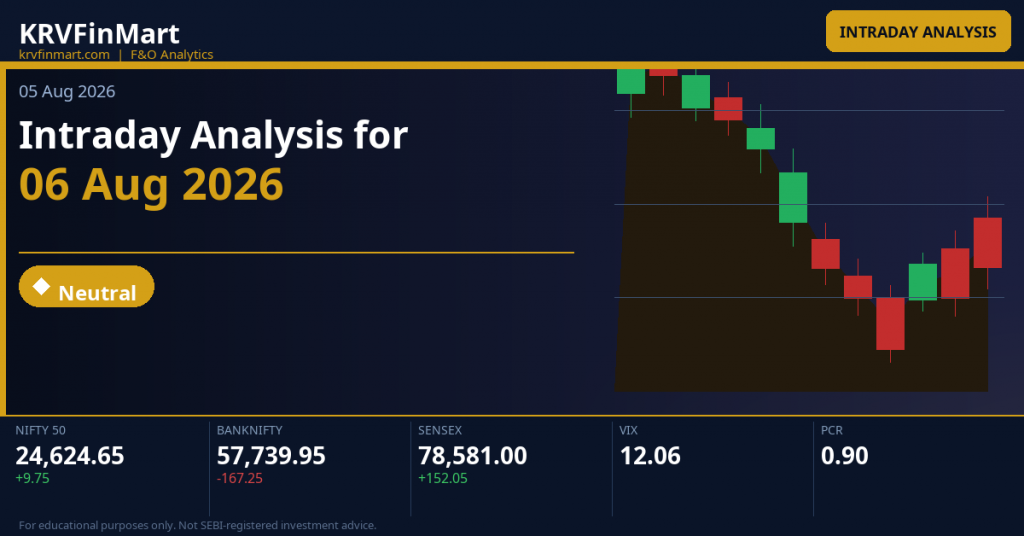
Intraday Analysis for 06 Aug 2026
Key Market Signals — Intraday Setup
All three indices are trading above their respective monthly CPR bands but within weekly and daily CPR overlap zones, suggesting the broader trend is cautiously bullish yet consolidating — BANKNIFTY’s negative close and proximity to the monthly CPR narrow band (57,294.10–57,310.22) warrants particular attention as it could be the weakest link that determines intraday leadership. The absence of India VIX data amplifies the importance of the first 15-minute candle direction for all three indices, as narrow CPR widths of 0.05%–0.10% historically produce decisive trend days when the opening direction is confirmed with above-average volume.
Deep Technical Analysis & Levels
|
Market Structure
Trending (up or down trend) |
Straddle
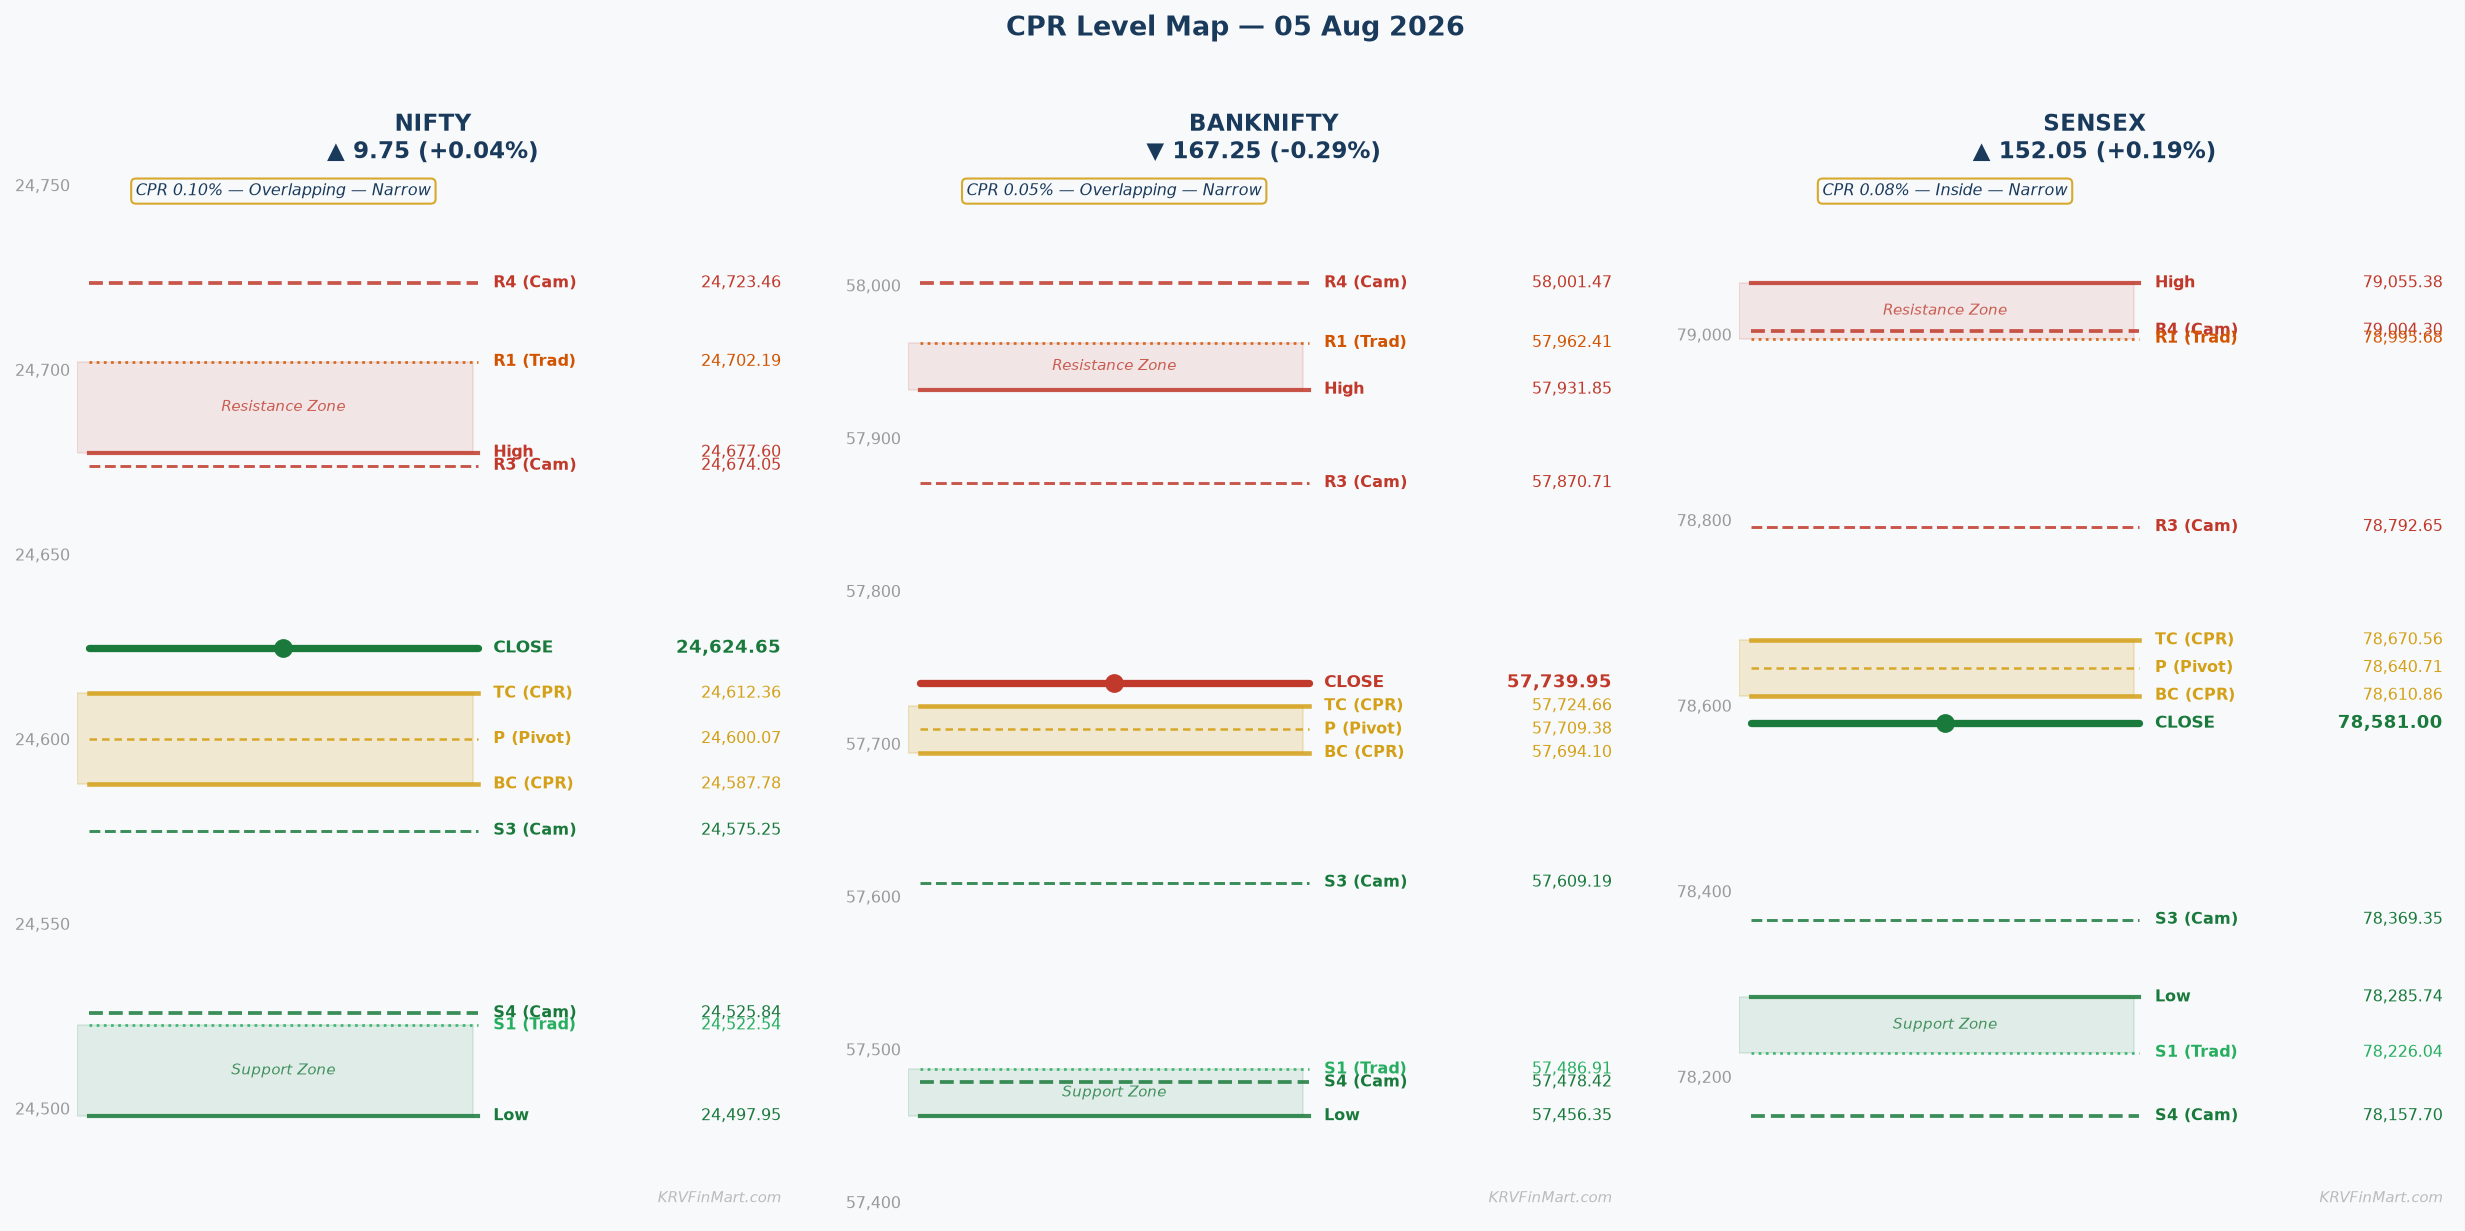
ATM 24,600 weekly straddle = **274.4 points** (Call 132.95 + Put 141.45), implying an expected intraday move of approximately ±137 points from 24,600, placing the upper boundary near 24,737 and the lower boundary near 24,463 — this range brackets key levels H4 (24,723.46) on the upside and L4 (24,525.84) on the downside, making straddle boundaries structurally coincident with Camarilla breakout triggers. |
Max Pain
NIFTY Weekly Max Pain = **24,550** (11-Aug-2026 expiry) — this strike sits just below the CPR band (BC 24,587.78), suggesting option sellers benefit most if NIFTY settles near 24,550 by weekly expiry; intraday price action that gravitates back toward this zone after any early spike should be treated as a gravitational pull from MM hedging, making the CPR band (24,587.78–24,612.36) the most contested battleground of the session. |
▲ Bullish
|
▲ Upside Path → OI-R
**H3 (24,674.05) → PDH (24,677.60) → R1 (24,702.19) → H4 (24,723.46) → R2 (24,779.72) / H5 (24,781.17) → OI-R (25,000)** — the first cluster of H3 and PDH at 24,674–24,677 is the immediate supply zone to absorb; a 15-min close above PDH propels price to R1 (24,702.19), and sustained trade above R1 with expanding volume activates the H4 breakout at 24,723.46, which is the structural confirmation of a true trending day rather than a mean-reversion day. Beyond H4, R2 (24,779.72) and H5 (24,781.17) form a tight confluence band at 24,780 that will require high-conviction volume to break through; if breached, H6 (24,805.23) and R3 (24,881.84) are the final pre-OI-R targets before the 25,000 CE OI wall becomes the dominant ceiling for the session. |
▼ Downside Path → OI-S
**Failure at PDH (24,677.60) → TC (24,612.36) → P (24,600.07) → BC (24,587.78) → L3 (24,575.25) → L4 (24,525.84) → S1 (24,522.54)** — if the gap-up open fails at PDH and the first 15-min candle closes back below TC (24,612.36), the CPR band role flips from launch pad to overhead resistance, and the day’s structure changes from trending-up to potential reversal; P (24,600.07) is the mathematical pivot where a 15-min close below it signals bears are taking control. A break below BC (24,587.78) with a 15-min close below it confirms the gap was fully trapped, targeting L3 (24,575.25) first, then the S1/L4 cluster at 24,522–24,525, which is a critical dual-confirmation support zone; below that, L5 (24,468.13) and L6 (24,444.07) come into play approaching the OI-S at 24,000 as the extreme bear scenario. |
| 🔴 OI-R: OI-R at **25,000** represents the most heavily written CE strike in both the weekly and monthly expiry, meaning large call sellers have established a massive supply wall that acts as the session’s ceiling — in a gap-up scenario, the 25,000 strike is psychologically and mechanically the target that drives bullish momentum, but also the level where gamma-induced dealer selling will be most intense as price approaches. The 374-point distance from the close (24,624.65 to 25,000) means OI-R is unlikely to be tested intraday unless there is an extraordinary macro catalyst; it functions more as the weekly magnet target over 3–5 sessions, and intraday traders should treat H5 (24,781.17) and H6 (24,805.23) as the realistic ceiling for a gap-up day rather than reaching for the full OI-R. | 🟢 OI-S: OI-S at **24,000** is the most heavily written PE strike providing the structural floor for the week, and in a gap-up scenario it is the extreme abort level that is entirely irrelevant unless a catastrophic reversal occurs — the 624-point gap between close and OI-S means put sellers at 24,000 are comfortable and not under pressure, providing a passive support base that eliminates tail-risk fear from intraday trading. Traders should note that the 24,000 PE OI acts as a long-term anchor confirming the broader market’s bullish positioning, meaning any dip toward L3 (24,575.25) or L4 (24,525.84) is more likely to be a buying opportunity rather than a breakdown — OI-S at 24,000 essentially backstops the entire intraday risk framework. |
▼ Bearish
|
▲ Upside Path → OI-R
**BC (24,587.78) → P (24,600.07) → TC (24,612.36) → H3 (24,674.05) → PDH (24,677.60) → R1 (24,702.19)** — the recovery path begins with a 30-min close above BC (24,587.78) as the structural reclaim signal; once above P (24,600.07), the mathematical pivot provides support, and a TC (24,612.36) reclaim re-establishes the trending structure. H3 (24,674.05) and PDH (24,677.60) are the final resistance cluster before R1 (24,702.19), and a full recovery to R1 on a gap-down day would be an extraordinary bullish signal confirming institutional accumulation at lower levels. |
▼ Downside Path → OI-S
**L3 (24,575.25) → L4 (24,525.84) / S1 (24,522.54) → L5 (24,468.13) → L6 (24,444.07) → S2 (24,420.42) → OI-S (24,000)** — L3 (24,575.25) is the Camarilla mean-reversion zone where first-wave bears take partial profits; retail stop-losses positioned below L3 accelerate the fall toward the dual-support S1/L4 cluster at 24,522–24,525, which is the most critical support zone of the session. Below L4 (24,525.84), L5 (24,468.13) and L6 (24,444.07) represent the Camarilla extended downside targets where straddle put-leg monetisation occurs; S2 (24,420.42) is the Traditional second support before the distant OI-S at 24,000 represents the structural absolute floor. |
| 🔴 OI-R: OI-R at **25,000** in a gap-down scenario is a distant and irrelevant overhead ceiling — the 500+ point gap between the gap-down open and OI-R means call sellers at 25,000 are entirely comfortable and exert no meaningful gamma pressure on intraday price action. What matters is that the CE OI at 25,000 confirms broad bullish positioning from option writers who believe the market will not reach that level, providing a psychological anchor that limits any intraday short from becoming a structural medium-term bear position — the OI-R at 25,000 is the macro ceiling, not the intraday concern. | 🟢 OI-S: OI-S at **24,000** is the primary bear target and PE monetisation zone in a significant or large gap-down — as price approaches the 24,000 strike, put holders who bought protection at lower strikes begin taking profits, and new put writers who believe 24,000 holds enter the market as buyers, creating a natural support mechanism. The 624-point distance from yesterday’s close means 24,000 OI-S is a weekly or multi-day target rather than an intraday one; however, in the context of a large gap-down day, the market’s direction toward 24,000 would confirm a regime change and put sellers would face maximum loss scenarios, triggering covering rallies — making 24,000 both the fear target and the potential reversal zone. |
◆ Neutral
|
▲ Upside Path → OI-R
**TC (24,612.36) → H3 (24,674.05) → PDH (24,677.60) → R1 (24,702.19) → H4 (24,723.46) → R2 (24,779.72) / H5 (24,781.17) → OI-R (25,000)** — the immediate targets after TC confirmation are H3 (24,674.05) and PDH (24,677.60), a tight cluster that provides the first major test; a 15-min close above PDH on above-average volume activates the R1 (24,702.19) target, and sustained trade above R1 confirms the session is a trending-up day. H4 (24,723.46) is the Camarilla breakout trigger that separates a scalp-long day from a full trend day; above H4, the R2/H5 confluence at 24,780 is the primary profit-booking zone before the distant OI-R ceiling at 25,000. |
▼ Downside Path → OI-S
**BC (24,587.78) → L3 (24,575.25) → L4 (24,525.84) / S1 (24,522.54) → L5 (24,468.13) → L6 (24,444.07) → OI-S (24,000)** — below BC (24,587.78), L3 (24,575.25) is the first Camarilla mean-reversion reference where a first partial short profit should be taken; retail stop-losses from long positions entered at or above BC cascade the move toward the critical dual-support S1/L4 zone at 24,522–24,525. A 15-min close below L4 (24,525.84) with above-average volume unlocks the extended Camarilla targets at L5 (24,468.13) and L6 (24,444.07) — the zone where straddle put-leg monetisation creates the most intense intraday activity — before the dominant OI-S at 24,000 provides structural support. |
| 🔴 OI-R: OI-R at **25,000** in the flat-open scenario represents the dominant CE OI wall that defines the weekly session’s upper boundary — for the flat-open intraday trader, 25,000 is too distant to be an immediate target (375 points away) but its presence confirms that call sellers are comfortable with the current level, implying they do not expect NIFTY to breach 25,000 this week, which creates a ceiling-effect that limits upside momentum as price approaches H5 (24,781.17) and H6 (24,805.23). The CE writing at 25,000 also means that any rally toward 24,800–24,900 on a flat-open day will encounter increasingly aggressive call selling from institutional desks defending the 25,000 position, making R3 (24,881.84) the practical daily ceiling rather than OI-R itself. | 🟢 OI-S: OI-S at **24,000** in the flat-open scenario is the dominant PE OI floor that prevents intraday traders from getting aggressively short for multi-session targets — the massive put writing at 24,000 signals that institutional put sellers believe the market has extremely low probability of breaching this level, providing a backstop that effectively limits the psychological downside risk for buyers. For the flat-open intraday trader, OI-S at 24,000 means that even if the downside scenario plays out fully to L6 (24,444.07) and S2 (24,420.42), the market is unlikely to see genuine panic selling — making any dip below 24,500 a potential buy zone backed by the structural PE support at 24,000. |
|
Market Structure
Trending (up or down trend) |
Straddle
ATM 57,700 monthly straddle = **1,397.0 points** (Call 752.0 + Put 645.0), implying an expected intraday move of approximately ±699 points from 57,700, placing the upper boundary near 58,399 and the lower boundary near 57,001 — this range directly coincides with Traditional R3 (58,437.91) on the upside and S3 (57,011.41) on the downside, and notably the OI-R at 58,000 and OI-S at 57,000 sit precisely within these straddle boundaries, making them both structurally defined and options-flow confirmed targets. |
Max Pain
BANKNIFTY Monthly Max Pain = **57,800** (25-Aug-2026 expiry) — this strike sits just above the CPR band (BC 57,694.10 to TC 57,724.66) and only 60 points above yesterday’s close of 57,739.95, suggesting that option sellers benefit most if BANKNIFTY gravitates toward 57,800 — a level that is essentially at the CPR’s upper boundary plus a small premium, meaning the CPR band and Max Pain are in near-perfect alignment, strongly implying a range-bound gravity pull toward 57,724–57,800 as the session’s magnetic center. |
▲ Bullish
|
▲ Upside Path → OI-R
**H3 (57,870.71) → PDH (57,931.85) → R1 (57,962.41) → H4/OI-R (58,001.47 / 58,000) → H5 (58,154.20) → H6 (58,217.80) → R2 (58,184.88)** — the upside path requires absorbing the PDH (57,931.85) which was yesterday’s high and a significant reference point; a 15-min close above PDH activates R1 (57,962.41) as the first Traditional target, and from R1 price is only 37 points from the dual OI-R and H4 breakout trigger at 58,000–58,001, which is the session’s most important resistance cluster. Above H4 and OI-R, H5 (58,154.20) and R2 (58,184.88) are the extended targets where straddle call-leg monetisation creates selling pressure — a first partial at R1, second partial at H4/OI-R, and trail stop above BC for any remaining position is the recommended approach. |
▼ Downside Path → OI-S
**Failure at H3 (57,870.71) → TC (57,724.66) → P (57,709.38) → BC (57,694.10) → L3 (57,609.19) → L4 (57,478.42) / S1 (57,486.91) → OI-S (57,000)** — the failure path begins with rejection at H3 (57,870.71), the Camarilla mean-reversion zone where aggressive sellers enter; if TC (57,724.66) is lost on a 15-min close, the CPR band role flips to resistance, and P (57,709.38) and BC (57,694.10) become the critical tests. Below BC (57,694.10), L3 (57,609.19) is the first downside Camarilla target; the S1/L4 cluster at 57,478–57,487 is the most important intraday support zone before the OI-S at 57,000 becomes the ultimate floor. |
| 🔴 OI-R: OI-R at **58,000** is the most critical level of the entire BANKNIFTY intraday session — it is not just a CE OI wall but also coincides with H4 (58,001.47) at virtually the same price, creating a dual Camarilla-Options confirmation resistance zone where both technical and options-flow sell pressure converge with maximum intensity. In a gap-up scenario, 58,000 is the ceiling that call sellers defend vigorously; dealers who are short gamma at 58,000 CE will be selling futures aggressively as price approaches, creating a mechanical headwind that requires extraordinary buying volume to overcome — for intraday traders, this level is the non-negotiable first partial profit target for longs and the primary entry zone for fade-shorts. | 🟢 OI-S: OI-S at **57,000** in a gap-up scenario is the structural floor that is 739 points below the previous close — in a gap-up day, this level is the abort zone for any bearish tail-risk hedging and confirms that put sellers at 57,000 are entirely unchallenged, providing a passive support anchor that eliminates panic-selling risk from intraday positions. The 57,000 PE OI wall is the monthly structure’s backbone, and its distance from current price means that intraday long traders can size positions with confidence knowing that the structural options floor provides significant cushion — even in the worst-case gap-fill scenario, 57,000 is unlikely to be breached intraday under normal market conditions. |
▼ Bearish
|
▲ Upside Path → OI-R
**BC (57,694.10) → P (57,709.38) → TC (57,724.66) → Max Pain (57,800) → H3 (57,870.71) → R1 (57,962.41) → OI-R (58,000)** — recovery begins with BC (57,694.10) as the first structural reclaim target; P (57,709.38) and TC (57,724.66) are the CPR band levels that, when reclaimed, confirm the gap-down was a liquidity sweep rather than a directional breakdown. Max Pain at 57,800 is the gravitational pull target for the monthly expiry — a gap-down that recovers to Max Pain by the end of the session is actually a bullish signal for the weekly outlook, and H3 (57,870.71) followed by R1 (57,962.41) are the extension targets that confirm a full recovery session. |
▼ Downside Path → OI-S
**L3 (57,609.19) → L4 (57,478.42) / S1 (57,486.91) → PDL (57,456.35) → L5 (57,325.68) → L6 (57,262.10) → S2 (57,233.88) → S3 (57,011.41) → OI-S (57,000)** — L3 (57,609.19) is the first Camarilla mean-reversion zone where first-wave bears take partial profits on gap-down shorts; the S1/L4 cluster at 57,478–57,487 and PDL (57,456.35) form a triple confluence support zone that must be breached to confirm a genuine trending bear day. Below PDL (57,456.35), retail stop-losses trigger accelerating selling toward L5 (57,325.68) and L6 (57,262.10); the most critical bear target of the session is S3 (57,011.41) which nearly coincides with the OI-S at 57,000, creating a dual Traditional-Options support zone where put sellers make maximum effort to defend. |
| 🔴 OI-R: OI-R at **58,000** in the gap-down scenario functions as the distant overhead ceiling that confirms shorts are structurally protected — the 306-point distance between a flat open and 58,000, increasing further in a gap-down, means call sellers at 58,000 face no immediate threat and will not need to buy back calls to manage delta, so there is no mechanical short-covering flow to support price from above. The OI-R at 58,000 acts as a psychological weight on any recovery rally — even if price recovers from the gap-down, the knowledge that 58,000 is a heavily-defended CE wall limits the enthusiasm of recovery buyers and makes any bounce toward H3 (57,870.71) or R1 (57,962.41) a fade opportunity rather than a breakout trade. | 🟢 OI-S: OI-S at **57,000** is the primary PUT monetisation zone and the most important support level in BANKNIFTY’s entire monthly framework — as price approaches 57,000, put holders who bought weekly and monthly puts begin aggressive profit-taking, and new institutional put sellers who believe 57,000 is the floor enter the market as net buyers of futures, creating the most powerful mechanical support the session can generate. The S3 (57,011.41) Traditional level at virtually the same price as OI-S (57,000) creates a dual-confirmation support zone — any intraday test of 57,000–57,011 should be treated as the highest-probability mean-reversion buy zone in the gap-down scenario, with stop-loss below 56,900 and target recovery to BC (57,694.10). |
◆ Neutral
|
▲ Upside Path → OI-R
**TC (57,724.66) → Max Pain (57,800) → H3 (57,870.71) → PDH (57,931.85) → R1 (57,962.41) → H4/OI-R (58,001.47 / 58,000)** — the immediate first target after TC confirmation is Max Pain at 57,800, which at only 75 points away from the flat open represents the easiest and highest-probability intraday target in this scenario; the gravity pull of 57,800 for monthly option sellers makes it the default destination. H3 (57,870.71) is the Camarilla first resistance where mean-reversion sellers attempt to cap the move; a hold above H3 after the first retest activates PDH (57,931.85) and R1 (57,962.41) as targets before the dominant OI-R wall at 58,000 / H4 (58,001.47) becomes the session ceiling requiring maximum volume to breach. |
▼ Downside Path → OI-S
**BC (57,694.10) → L3 (57,609.19) → L4 (57,478.42) / S1 (57,486.91) → PDL (57,456.35) → L5 (57,325.68) → OI-S (57,000)** — below BC (57,694.10), L3 (57,609.19) is the first Camarilla downside target where mean-reversion buyers typically attempt a bounce; if L3 fails on a 15-min close below it, the triple-support zone of L4/S1/PDL at 57,456–57,487 becomes the critical intraday test. A break below PDL (57,456.35) with volume confirms a trending bear day with extension toward L5 (57,325.68) and L6 (57,262.10), ultimately targeting the structurally-dominant OI-S at 57,000 as the straddle lower boundary and put-writing floor. |
| 🔴 OI-R: OI-R at **58,000** in the flat-open scenario is the dominant CE OI wall that simultaneously coincides with H4 (58,001.47) — this dual confluence creates the session’s hardest resistance ceiling, and in the flat-open scenario it serves as the primary profit target for bulls and the primary entry zone for institutional fade-shorts. The proximity of H4 (58,001.47) to the OI-R (58,000) makes this zone the highest-density options-and-technical resistance in all of BANKNIFTY’s Camarilla structure for this session — any approach to 58,000 on a flat-open day should be treated as maximum conviction required to continue, and partial profits should be secured aggressively at R1 (57,962.41) before attempting to breach OI-R. | 🟢 OI-S: OI-S at **57,000** in the flat-open scenario is the structural monthly floor that provides backstop confidence for intraday traders — the 740-point distance from the flat open means 57,000 is not a realistic intraday target under normal conditions, but its presence confirms that put sellers have defined a maximum downside that makes any intraday long trade in BANKNIFTY structurally protected below 57,000. For flat-open traders, OI-S at 57,000 means the downside risk on any long position entered above BC (57,694.10) with a stop at L4 (57,478.42) is structurally capped at L5 (57,325.68) / L6 (57,262.10) before the options floor provides mechanical support — making the risk-reward on flat-open CPR-based longs favorable. |
|
Market Structure
Trending (up or down trend) |
Straddle
ATM 78,600 weekly straddle = **565.85 points** (Call 240.0 + Put 325.85), implying an expected intraday move of approximately ±283 points from 78,600, placing the upper boundary near 78,883 and lower boundary near 78,317 — the weekly straddle boundaries almost perfectly coincide with PDH (79,055.38) on the upside (240 points above) and PDL (78,285.74) on the downside (314 points below), confirming that the straddle pricing is calibrated to the previous session’s range and that any breakout beyond PDH or PDL would consume the entire weekly straddle in a single session. |
Max Pain
SENSEX Weekly Max Pain = **78,500** (06-Aug-2026 expiry — today is expiry day) — with today being the weekly expiry for SENSEX, Max Pain at 78,500 carries maximum influence on intraday price action as option sellers and market makers actively manage their positions to pin price near 78,500; the CPR band (BC 78,610.86 to TC 78,670.56) sits just above Max Pain at 78,500 by 110–170 points, creating a gravitational battle between Max Pain pull (downward toward 78,500) and CPR support (upward toward 78,610–78,671), making this the most structurally complex index for today’s session. |
▲ Bullish
|
▲ Upside Path → OI-R
**TC (78,670.56) → H3 (78,792.65) → R1 (78,995.68) / H4 (79,004.30) → PDH (79,055.38) → H5 (79,251.51) → H6 (79,353.54) → R2 (79,410.35) → OI-R (81,000)** — the Inside CPR double-compression release path begins with H3 (78,792.65) as the first meaningful resistance; above H3, the triple cluster of R1 (78,995.68), H4 (79,004.30), and PDH (79,055.38) at approximately 79,000–79,055 is the most critical resistance zone of the session. H5 (79,251.51) and H6 (79,353.54) are the Camarilla extended upside targets for a true trending-up day, and OI-R at 81,000 — while 2,419 points above the close — represents the absolute structural ceiling that option writers are defending for the monthly expiry, making it an irrelevant intraday target but a relevant 2–3 week directional target. |
▼ Downside Path → OI-S
**Failed TC (78,670.56) → P (78,640.71) → BC (78,610.86) → Max Pain (78,500) → L3 (78,369.35) → PDL (78,285.74) → S1 (78,226.04)** — in a gap-up failure scenario on SENSEX expiry day, Max Pain at 78,500 is the most powerful gravitational attractor; the path from TC (78,670.56) failure to Max Pain (78,500) is only 170 points and represents the highest-probability intraday mean-reversion target if the double-compression release fails. Below Max Pain (78,500), L3 (78,369.35) is the first Camarilla support zone; PDL (78,285.74) and S1 (78,226.04) form a dual support cluster that is the bear target in a failed gap-up expiry day scenario — the gap-fill trade from the failed double-compression release often overshoots to the downside on expiry days. |
| 🔴 OI-R: OI-R at **81,000** is the SENSEX weekly CE OI wall that represents a massive 2,419-point ceiling above yesterday’s close — this extreme distance makes OI-R an irrelevant intraday target for the higher-open scenario, but its existence confirms that institutional call sellers are positioned for SENSEX to remain well below 81,000 this week, providing a structural ceiling that confirms the overall bullish-but-bounded market structure. For intraday purposes in the gap-up scenario, OI-R at 81,000 functions as a ‘confirm the bull trend has room to run’ signal — the wide distance to the CE OI wall means there is no meaningful call-writer resistance until 81,000, so any intraday move toward H5 (79,251.51) or H6 (79,353.54) encounters only technical resistance (Camarilla levels) rather than options-flow resistance, making the rally path cleaner than in NIFTY or BANKNIFTY. | 🟢 OI-S: OI-S at **77,000** is the dominant SENSEX weekly PE OI floor, 1,581 points below yesterday’s close — this enormous distance confirms that put sellers at 77,000 are entirely unchallenged in the gap-up scenario and are providing a structural base that eliminates any realistic fear of a single-session collapse to the options floor. The 77,000 PE OI confirms broad institutional confidence in SENSEX’s medium-term support, and for gap-up intraday traders it serves as the ultimate backstop that allows position sizing with confidence; even Max Pain at 78,500 (today’s expiry pull) provides secondary support well above OI-S, creating a double-layer safety net for bullish intraday positions entered above TC (78,670.56). |
▼ Bearish
|
▲ Upside Path → OI-R
**L3 (78,369.35) hold → Max Pain (78,500) → BC (78,610.86) → P (78,640.71) → TC (78,670.56) → H3 (78,792.65)** — the recovery path on a gap-down day in SENSEX expiry is uniquely influenced by Max Pain at 78,500 as the first and most powerful gravitational target; a bounce from L3 (78,369.35) toward 78,500 is the highest-probability mean-reversion trade of the session. Above Max Pain (78,500), BC (78,610.86) is the CPR bottom and the structural reclaim level; P (78,640.71) and TC (78,670.56) complete the CPR band reclaim, and H3 (78,792.65) is the Camarilla mean-reversion resistance where short-covering fuel typically exhausts on a gap-down recovery day. |
▼ Downside Path → OI-S
**L3 (78,369.35) → PDL (78,285.74) → S1 (78,226.04) → L4 (78,157.70) → L5 (77,910.49) → L6 (77,808.46) / S2 (77,871.07) → S3 (77,456.40) → OI-S (77,000)** — the critical Inside CPR downside path starts with L3 (78,369.35) as the first Camarilla downside reference zone; PDL (78,285.74) and S1 (78,226.04) form a dual support that, if broken on a 15-min close below, confirms an extraordinary expiry-day bear session. L4 (78,157.70) is the Camarilla breakdown trigger — a 15-min close below L4 activates L5 (77,910.49) and L6 (77,808.46), the extended downside targets; S2 (77,871.07) nearly coincides with L6, creating a double-confirmation zone before S3 (77,456.40) and OI-S (77,000) define the session’s extreme downside. |
| 🔴 OI-R: OI-R at **81,000** in the gap-down scenario is entirely irrelevant for intraday price action — the 2,919+ point gap between a gap-down open and the CE OI wall means call sellers at 81,000 face zero delta pressure and exert no mechanical influence on the session’s direction. The extreme distance of OI-R at 81,000 from the current price range paradoxically confirms the bullish medium-term structure — institutional call sellers at 81,000 have a massive premium buffer and are comfortable in their positions, signaling that the broader market view is that SENSEX will not reach 81,000 in the near term, making the gap-down scenario a buying opportunity from a medium-term perspective even as intraday bears control the session. | 🟢 OI-S: OI-S at **77,000** is the primary SENSEX weekly PE OI floor and the most relevant options-flow level in a gap-down scenario — as price approaches 77,000 (1,581 points below yesterday’s close, a scenario requiring approximately 2% intraday decline), put sellers who wrote 77,000 puts will face maximum pressure and begin aggressively buying futures to delta-hedge, creating a mechanical support floor. For the gap-down intraday session, OI-S at 77,000 is the catastrophic scenario anchor — it is not a realistic intraday target under normal market conditions, but its existence means that even extreme downside scenarios have a defined floor, allowing traders to size positions rationally; any approach to L5 (77,910.49) and L6 (77,808.46) should be considered for long entry with the OI-S at 77,000 as the structural backstop. |
◆ Neutral
|
▲ Upside Path → OI-R
**TC (78,670.56) → H3 (78,792.65) → R1 (78,995.68) → H4 (79,004.30) → PDH (79,055.38) → H5 (79,251.51) → OI-R (81,000)** — the Inside CPR upside release path begins with H3 (78,792.65), the Camarilla mean-reversion zone where first-wave sellers attempt to cap the move at 122 points above TC; a sustained hold above H3 with increasing volume activates the critical triple resistance at R1 (78,995.68) / H4 (79,004.30) / PDH (79,055.38) — approximately 79,000–79,055 — which is the most important resistance cluster of the upside path and requires maximum conviction and volume to breach on expiry day. H5 (79,251.51) and H6 (79,353.54) are the extended Camarilla targets for a genuine trending-up expiry day, and the distant OI-R at 81,000 confirms there is no options-flow resistance between current levels and 81,000, giving bulls a structurally clean runway. |
▼ Downside Path → OI-S
**BC (78,610.86) → Max Pain (78,500) → L3 (78,369.35) → PDL (78,285.74) → S1 (78,226.04) → L4 (78,157.70) → L5 (77,910.49) → OI-S (77,000)** — the Inside CPR downside release path is uniquely influenced by Max Pain at 78,500 as the primary expiry-day gravitational target; the 110-point distance from BC (78,610.86) to Max Pain (78,500) means that any break below BC almost immediately reaches the expiry pin zone. Below Max Pain (78,500), L3 (78,369.35) is the first Camarilla downside reference and the technical bear target; a 15-min close below L3 (78,369.35) on above-average volume confirms that the Inside CPR downside release is exceeding expiry-day pin expectations, activating PDL (78,285.74) / S1 (78,226.04) / L4 (78,157.70) as the session’s bear targets before the structural OI-S at 77,000 provides the ultimate floor. |
| 🔴 OI-R: OI-R at **81,000** in the flat-open expiry-day scenario is the medium-term structural ceiling that is irrelevant for today’s intraday price action but deeply relevant for the directional context — the CE OI wall at 81,000 being 2,419 points above current price confirms that option writers collectively believe SENSEX will not reach 81,000 this week or in the near term, providing a macro ceiling that validates the ‘trending but bounded’ market structure. For flat-open expiry day intraday traders, OI-R at 81,000 means that bullish positions above TC (78,670.56) have structural runway through H3, H4, H5, and PDH before encountering meaningful options-flow resistance — the technical levels (Camarilla and Traditional) are the only real resistance until 81,000, making the bull trade structurally clean but technically challenging at each Camarilla level. | 🟢 OI-S: OI-S at **77,000** in the flat-open expiry-day scenario is the PE OI floor that, combined with today’s Max Pain at 78,500, creates a two-tier support structure — Max Pain (78,500) is the first gravitational support layer activated by expiry-day dynamics, and OI-S (77,000) is the second and deeper structural support layer activated by put seller defense in the monthly options framework. For flat-open traders, the combination of Max Pain at 78,500 and OI-S at 77,000 means that short positions below BC (78,610.86) should be managed carefully with awareness that (1) expiry gravity will create intraday bounces toward 78,500, and (2) the 77,000 PE OI wall limits the realistic downside to approximately 1,600 points — making aggressive short positions with targets below 77,000 unsupported by the options flow framework. |
The collective picture for 06 Aug 2026 presents a high-probability trending-day setup across all three indices — NIFTY’s Overlapping Narrow (0.10%) CPR, BANKNIFTY’s Overlapping Narrow (0.05%) CPR, and SENSEX’s Inside Narrow (0.08%) CPR with today as SENSEX expiry all point to decisive directional sessions where the first 15-min candle close above/below TC/BC is the primary trading signal and should be acted upon without hesitation. The SENSEX weekly expiry adds a time-based dimension with Max Pain at 78,500 acting as a gravitational pull throughout the day, while BANKNIFTY’s Max Pain at 57,800 aligns closely with its CPR TC (57,724.66), suggesting the path of least resistance for BANKNIFTY is a mild upward drift toward 57,800–57,870 in the absence of a significant gap opening. Bulls control the structure as long as NIFTY holds above BC (24,587.78), BANKNIFTY holds above BC (57,694.10), and SENSEX holds above BC (78,610.86) through the first 15-minute candle — a simultaneous breach of all three BC levels would signal coordinated institutional selling and activate the L3→L4 downside path across all indices.
This analysis is for educational purposes only and is not investment advice.
Responses