Intraday Analysis for 07 Aug 2026
Markets closed on a broadly positive note on 06 Aug 2026, with NIFTY adding a marginal +0.05% to settle at **24,636**, BANKNIFTY outperforming with a +0.56% gain to **58,063.65**, and SENSEX rising +0.48% to **78,954.76**. India VIX data is unavailable for this session, making it critical to lean on CPR structure, OI positioning, and straddle-implied moves as the primary volatility proxies for the coming session. The NIFTY weekly straddle implies a move of **249.85 points** from ATM 24,650, meaning the market is pricing in a range of roughly **24,400 to 24,900** for the week — traders must respect this band as the statistical boundary unless a strong directional catalyst emerges.
All three indices are trading above their respective monthly CPR mid-points but face narrowing day-CPR structures (NIFTY Ascending Narrow at 0.01%, BANKNIFTY Ascending Medium at 0.19%, SENSEX Ascending Medium at 0.14%), signalling that trend continuation is the dominant theme but requires immediate confirmation above respective TC levels at the open. OI walls at NIFTY 25,000 CE, BANKNIFTY 59,000 CE, and SENSEX 79,000 CE define the upside ceilings, while PE support at 24,000, 58,000, and 78,900 respectively anchor the downside floor for 07 Aug 2026.
NIFTY 50
|
NIFTY 50
24,636.00
▲ +11.35 (+0.05%)
|
INDIA VIX
12.16
▲ +0.81%
Low Fear Zone
|
PCR
|
OI PCR
Week: 0.92
Month: 1.16
|
Vol PCR
Week: 1.01
Month: 1.15
|
|
ATM STRADDLE
Week249.85 pts
Month496.15 pts
|
|
OI SUPPORT (PE)
Week24,000
Month24,000
|
OI RESIST (CE)
Week25,000
Month25,000
|
CPR RELATIONSHIP
DayAscending — Narrow
WeekOverlapping — Wide
MonthOverlapping — Wide
|
MAX PAIN
Week24,600
Month24,500
|
Week expiry: 11-Aug-2026 · Month expiry: 25-Aug-2026
BANK NIFTY
|
BANK NIFTY
58,063.65
▲ +323.70 (+0.56%)
|
INDIA VIX
12.16
▲ +0.81%
Low Fear Zone
|
PCR
|
OI PCR
Week: —
Month: 0.97
|
Vol PCR
Week: —
Month: 0.81
|
|
ATM STRADDLE
Month1,315.65 pts
|
|
OI SUPPORT (PE)
Month58,000
|
OI RESIST (CE)
Month59,000
|
CPR RELATIONSHIP
DayAscending — Medium
MonthOverlapping — Narrow
|
MAX PAIN
Month58,000
|
Month expiry: 25-Aug-2026
SENSEX
|
SENSEX
78,954.76
▲ +373.76 (+0.48%)
|
INDIA VIX
12.16
▲ +0.81%
Low Fear Zone
|
PCR
|
OI PCR
Week: 1.05
Month: 1.33
|
Vol PCR
Week: 1.01
Month: 0.90
|
|
ATM STRADDLE
Week45.20 pts
Month1,714.30 pts
|
|
OI SUPPORT (PE)
Week78,900
Month77,000
|
OI RESIST (CE)
Week79,000
Month79,000
|
CPR RELATIONSHIP
DayAscending — Medium
WeekOverlapping — Wide
MonthOverlapping — Wide
|
MAX PAIN
Week78,900
Month78,700
|
Week expiry: 06-Aug-2026 · Month expiry: 27-Aug-2026
NIFTY
Ascending — Narrow (Width: 0.01%)
▲ Bullish
|
Market Structure
Trending (up or down trend) |
Straddle
ATM 24,650 weekly straddle = **249.85 pts** (Call 142.4 + Put 107.45), implying an expected single-session move of roughly ±125 pts from ATM, putting the day’s statistical range approximately between **24,525 and 24,775**. The asymmetry (call premium > put premium) suggests slightly bullish skew in the near-term. |
Max Pain
Weekly max pain at **24,600** — just 36 points below yesterday’s close of 24,636. This implies option sellers are most comfortable with expiry near 24,600, creating gravitational pull toward that level on expiry day (11 Aug). For intraday on 07 Aug, this means rallies toward 24,700+ may face institutional selling pressure from options writers defending their 24,600 max pain zone. |
Tomorrow’s Complete Level Map
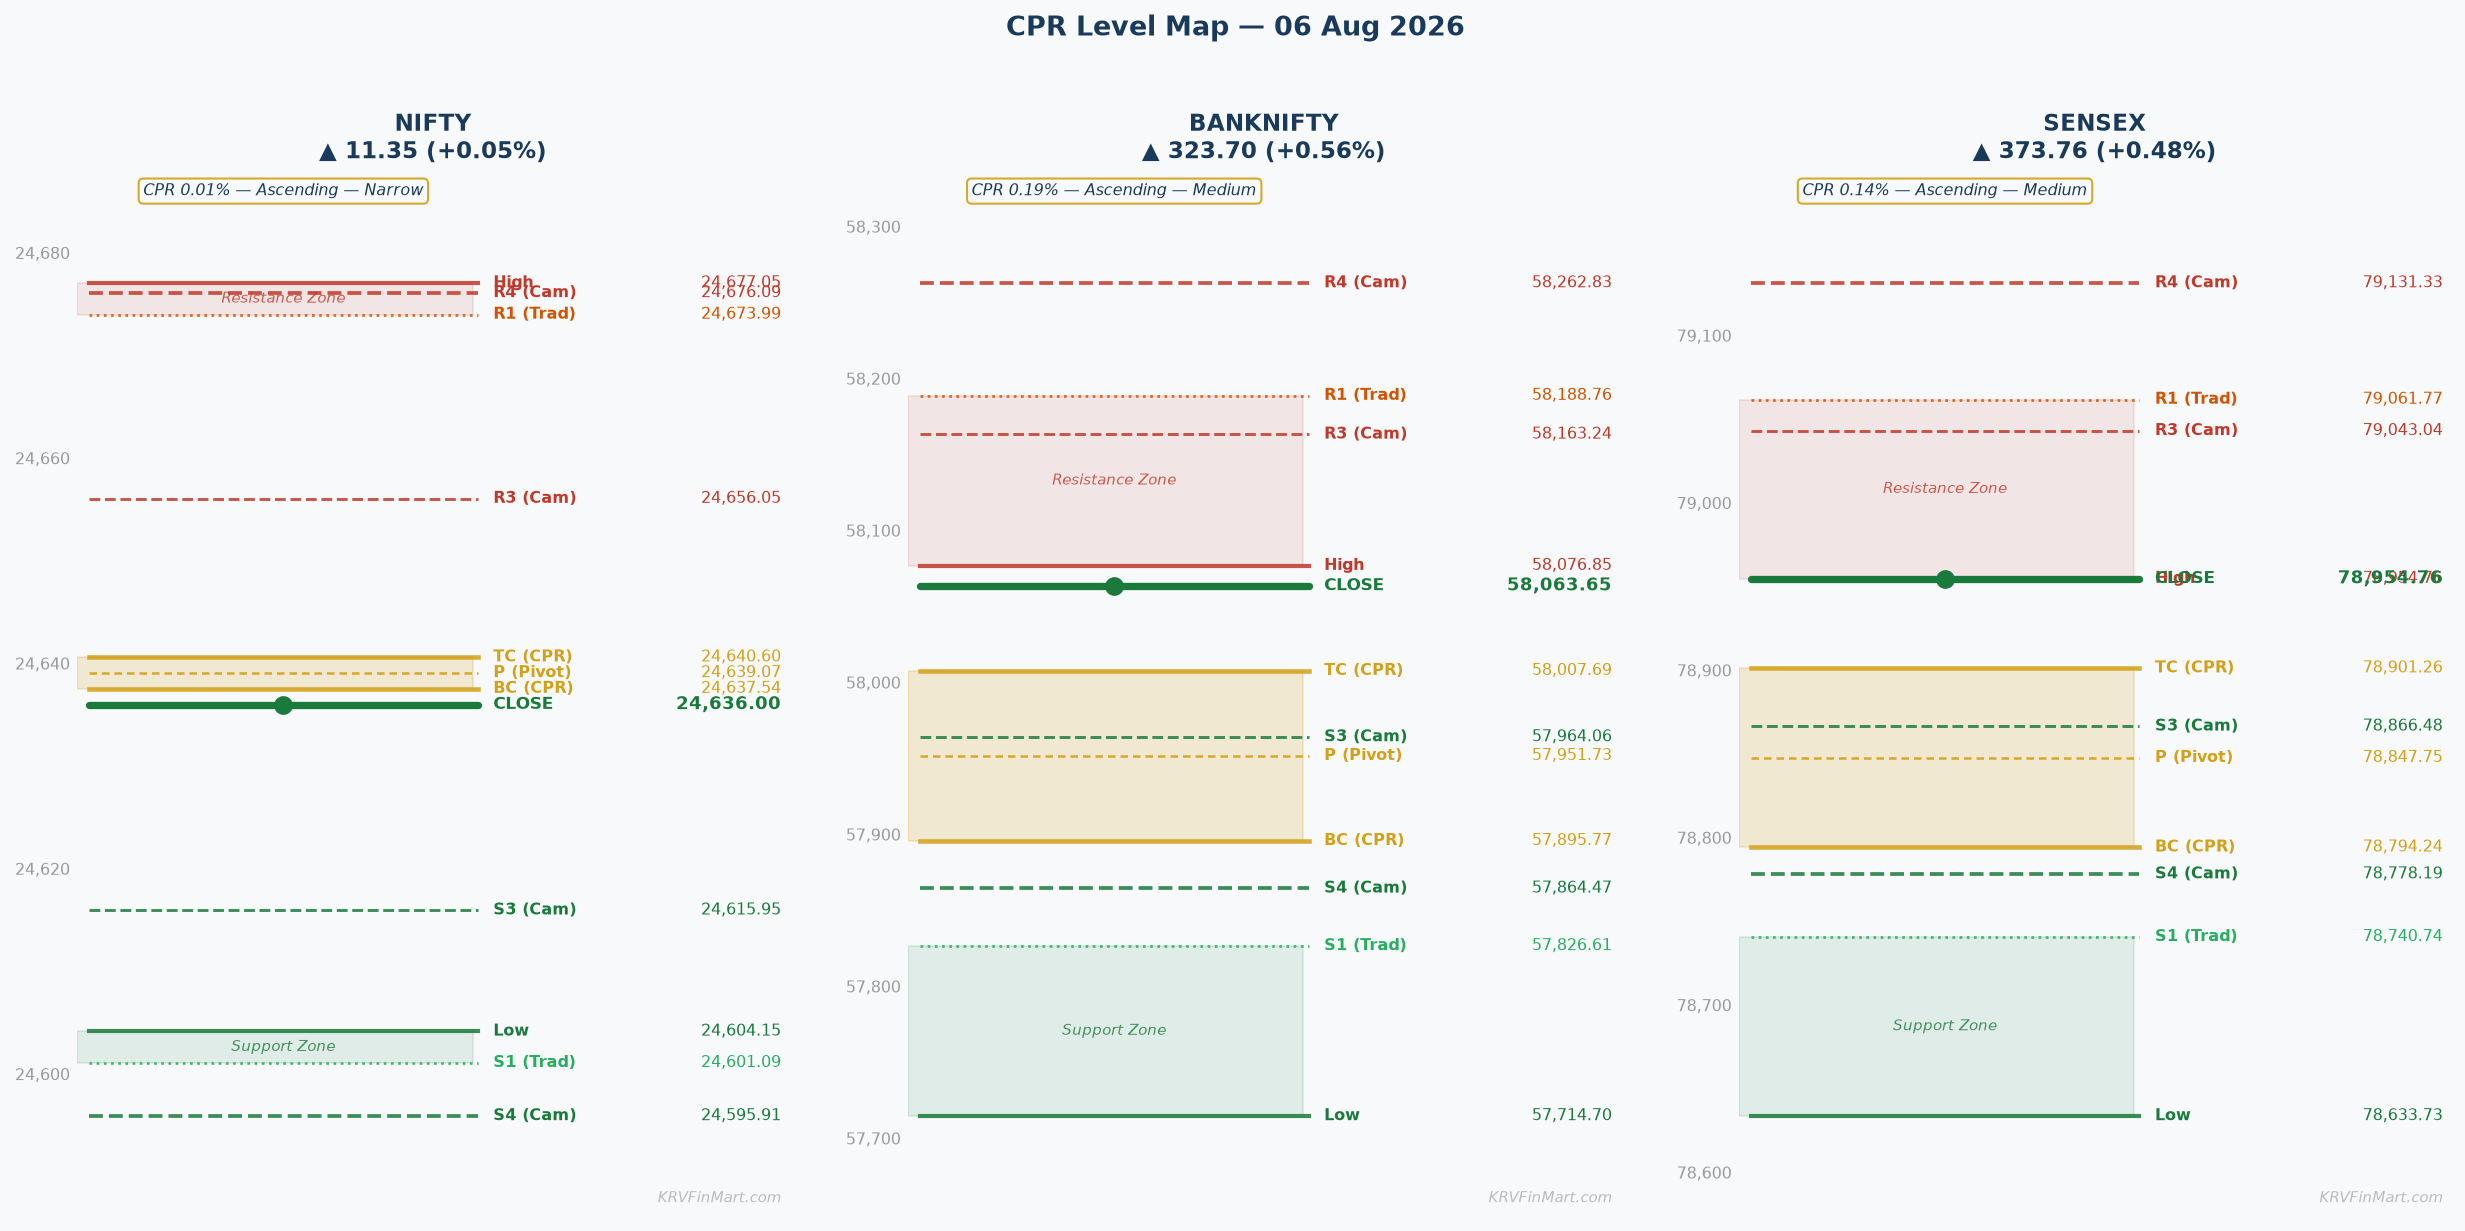
OI-R: 25,000 R3: 24,746.89 H6: 24,708.99 H5: 24,699.50 R2: 24,711.97 H4 ▶: 24,676.09 R1: 24,673.99 PDH: 24,677.05 H3 ↩: 24,656.05
TC: 24,640.60 P: 24,639.07 BC: 24,637.54
L3 ↩: 24,615.95 PDL: 24,604.15 S1: 24,601.09 L4 ▶: 24,595.91 S2: 24,566.17 L5: 24,572.50 L6: 24,563.01 S3: 24,528.19 OI-S: 24,000
↩ = Camarilla reversal point | ▶ = Camarilla breakout/breakdown trigger | OI-R/OI-S = Options wall (CE/PE max OI)
▲ Higher Open (Gap Up) — Open > Prev Close
▲ Bullish
Open lands: With an Ascending CPR where BC (24,637.54) > prev_TC, any gap-up open above the previous close of 24,636 means price opens inside or above the CPR band (BC 24,637.54 — TC 24,640.60). Even a minor 0.05–0.10% gap up brings price directly into or above TC 24,640.60, placing the entire CPR band below the open and acting as immediate support.
CPR role: Launch pad — the CPR band (BC 24,637.54 to TC 24,640.60) transitions into intraday support. As long as price holds above TC 24,640.60 on any pullback, bulls remain in structural control and the CPR acts as a base from which higher targets are measured.
Minor Gap (0.05–0.25%) — Structure Dominant
A minor gap up of 0.05–0.25% opens NIFTY in the range of approximately 24,648–24,697, placing price firmly above TC 24,640.60 and inside the Camarilla H3–H4 zone (24,656.05–24,676.09). The Ascending Narrow CPR (width 0.01%) strongly corroborates the bullish lean — on a trending day, this narrow CPR below the open functions as a confirmed launch pad rather than a contested pivot zone. The first structural target on the upside is H3 24,656.05 followed by the cluster at PDH 24,677.05, R1 24,673.99, and H4 24,676.09 — this tight cluster of four levels within a 21-point range (24,656–24,677) is the most important intraday resistance zone and a partial profit area; a first 15-minute candle close above H4 24,676.09 is the trigger for the next leg toward H5 24,699.50 and R2 24,711.97.
Significant Gap (0.25–0.5%) — Balanced
A significant gap up of 0.25–0.50% opens NIFTY approximately in the 24,697–24,759 range, pushing price directly into or above the H5 24,699.50 level and close to R2 24,711.97, meaning the market is immediately opening inside the upper Camarilla target zone. Gap-fill risk is meaningful here — the CPR band (BC 24,637.54 to TC 24,640.60) is now more than 60 points below the open, so any early selling pressure will first find support at H3 24,656.05, then PDH 24,677.05, before a deeper gap-fill attempt toward the CPR. Delta-hedging flows from options market makers will amplify directional momentum — if price sustains above H5 24,699.50 in the first 15 minutes, R2 24,711.97, H6 24,708.99, and R3 24,746.89 become the live targets; if H5 is rejected, expect a retracement to H4 24,676.09 and R1 24,673.99 as the pullback stabilisation zone.
Large Gap (>0.5%) — Gap Direction Dominant
A large gap up of over 0.50% opens NIFTY above 24,759, which is above R2 24,711.97 and potentially approaching R3 24,746.89 or beyond, opening price near the boundary of the weekly CPR and into significant overhead technical density. The probability of a full gap-fill toward the day CPR (24,637–24,641) increases substantially in large gap scenarios as market participants book overnight premium; however, the Ascending Narrow CPR combined with a trending market structure means that shallow gap-fills (back to H4 24,676.09 or H3 24,656.05) are more likely than complete fills to the CPR band unless macro negative news hits. The straddle-implied move of 249.85 points from ATM 24,650 caps the realistic upper boundary near 24,900 for the week, so upside beyond R3 24,746.89 should be treated with caution as a scalp-only zone; OI-R at 25,000 CE remains structurally overhead but is unlikely to be tested in a single session.
|
▲ Upside Path → OI-R
From TC 24,640.60, the upside path progresses to Camarilla H3 24,656.05 (first mean-reversion stall zone, take partial profits here), then into the critical H4 24,676.09 — R1 24,673.99 — PDH 24,677.05 cluster (Camarilla breakout trigger and traditional first target confluence, second partial profit, watch for above-average volume to sustain), and beyond that H5 24,699.50 — H6 24,708.99 — R2 24,711.97 as the upper Camarilla target band. The OI-R wall at **25,000 CE** is the macro ceiling — CE writers at this strike have significant open interest and will defend it aggressively; only extraordinary volume and a positive global catalyst justifies targeting beyond R3 24,746.89 intraday. |
▼ Downside Path → OI-S
If the gap-up fails to sustain above TC 24,640.60, the failure path drops price toward Pivot 24,639.07 and BC 24,637.54, and a close below BC on the first 15-minute candle changes the day’s entire structural bias from bullish to neutral-bearish. Below BC 24,637.54, the next downside reference is L3 24,615.95 (Camarilla mean-reversion support, potential bounce zone), followed by PDL 24,604.15 and the S1 24,601.09 — L4 24,595.91 cluster as the breakdown confirmation area that, if breached, opens the path to L5 24,572.50 — S2 24,566.17 and ultimately the OI-S floor at **24,000 PE** (which remains distant at 636 points and is a weekly, not intraday, target). |
|
🔴 OI-R: The **OI-R at 25,000 CE** represents the largest concentration of call option open interest for both the weekly and monthly series — CE writers (primarily institutions) have sold calls at this strike in volume, creating a structural ceiling that suppresses intraday rallies well before this level is tested. In a gap-up scenario, 25,000 is 364 points above the previous close, making it an aspirational target only; its real intraday role is as a gamma pressure backstop — as NIFTY approaches 24,900–25,000, delta hedging by option sellers will create increasing selling pressure and throttle momentum. |
🟢 OI-S: The **OI-S at 24,000 PE** represents the largest concentration of put open interest — PE writers have sold puts at 24,000 aggressively, implying strong institutional conviction that 24,000 will not be breached this week or month. In a gap-up scenario, 24,000 is 636 points below the open and is structurally irrelevant for intraday trading; it serves as the macro floor that prevents panic selling and provides psychological confidence for bulls to press the upside. |
⚡ Key Trigger: The key trigger for the gap-up scenario is the **first 15-minute candle closing and sustaining above TC 24,640.60** — given the Ascending Narrow CPR, this confirmation is extremely fast (first 15-min bar) and the CPR band of only 3.06 points (24,637.54 to 24,640.60) means a decisive open above TC with any conviction immediately validates the bull thesis. Failure to hold TC 24,640.60 on the first 15-minute close — i.e., a wick back below TC — signals a potential false gap-up and shifts the immediate bias back to neutral until the CPR band is decisively reclaimed.
▼ Lower Open (Gap Down) — Open < Prev Close
▼ Bearish
Open lands: In an Ascending CPR where BC (24,637.54) > prev_close (24,636.00) by a marginal 1.54 points, any gap-down open places price below BC 24,637.54 and below the entire CPR band. This is the Ascending CPR’s most bearish configuration — the entire CPR band acts as overhead resistance above the open.
CPR role: Overhead resistance / trap door — the CPR band (BC 24,637.54 to TC 24,640.60) sits entirely above the gap-down open and acts as a lid. Bulls must reclaim BC 24,637.54 first before any bullish reversal thesis has merit, and until then, the CPR is a ceiling that reinforces selling pressure.
Minor Gap (0.05–0.25%) — Structure Dominant
A minor gap down of 0.05–0.25% opens NIFTY approximately in the range of 24,575–24,624, placing price below BC 24,637.54 and the entire CPR band, but likely above or near L3 24,615.95 and PDL 24,604.15. The CPR acts as a hard overhead ceiling — unless price reclaims BC 24,637.54 within the first 30 minutes, the day remains structurally bearish with L3 24,615.95 as the first downside reference point and PDL 24,604.15 as a critical intraday support whose breach opens the way to S1 24,601.09 and L4 24,595.91. Minor gaps often attempt a fill in the first 60 minutes, so watch for a recovery attempt toward BC 24,637.54 — if this recovery is rejected with a 15-minute close back below 24,615.95, the bear case accelerates toward L4 24,595.91 and S2 24,566.17.
Significant Gap (0.25–0.5%) — Balanced
A significant gap down of 0.25–0.50% opens NIFTY in the range of approximately 24,513–24,574, placing price below PDL 24,604.15 and approaching S2 24,566.17 — L5 24,572.50 zone directly at the open. The CPR band (BC 24,637.54 to TC 24,640.60) is now 63–127 points overhead and acts as a formidable resistance zone; a gap-fill recovery would require two 30-minute closes above the CPR band — a high bar that makes the recovery scenario low probability in the first 90 minutes. The bear path from this open targets L5 24,572.50 first (Camarilla downside target, take partial profits on short puts), then L6 24,563.01, and S3 24,528.19 as the extended bear target — PE writing at these levels and below the 24,500 zone reflects institutional conviction about a range floor, and a flush to S3 24,528.19 is where short positions should be partially covered.
Large Gap (>0.5%) — Gap Direction Dominant
A large gap down of over 0.50% opens NIFTY below 24,513, breaching S3 24,528.19 and potentially opening near S4 24,490.21 — a scenario that brings the weekly CPR low and OI-S proximity into play as panic-selling dynamics take hold. In this scenario, the VIX (unavailable) would be assumed spiking, straddle premiums would expand well beyond the 249.85 implied move, and long puts bought near ATM would rapidly appreciate — straddle monetisation (selling the put leg into panic) is optimal between 24,528 and 24,490. Recovery levels to watch are BC 24,637.54 (requires an extraordinary reversal), and more realistically PDL 24,604.15 and L3 24,615.95 as targets for any stabilisation bounce from the extreme lows.
|
▲ Upside Path → OI-R
The gap-down recovery path requires price first reclaiming BC 24,637.54, then sustaining a 30-minute close above Pivot 24,639.07, and finally closing above TC 24,640.60 — at which point the structure shifts bullish with H3 24,656.05 as the first recovery target. A genuine recovery (not a dead-cat bounce) is confirmed by above-average volume on the 30-minute reclaim candle above TC 24,640.60, which then projects to H4 24,676.09 — R1 24,673.99 as the next target and OI-R 25,000 as the macro ceiling. |
▼ Downside Path → OI-S
The primary bear path from below BC 24,637.54 moves through L3 24,615.95 (first Camarilla support, expect a pause), then PDL 24,604.15 — S1 24,601.09 — L4 24,595.91 (the critical breakdown cluster where retail stop-losses below PDL accelerate the move), and onward to L5 24,572.50 — S2 24,566.17 as the extended bear zone. A sustained breakdown below L5 24,572.50 with volume opens L6 24,563.01 and S3 24,528.19, after which the OI-S floor at **24,000 PE** (636 points lower) becomes a weekly target but not a realistic intraday destination. |
|
🔴 OI-R: In a gap-down scenario, **OI-R at 25,000 CE** is the distant overhead ceiling — CE writers here are comfortable and have no delta pressure to hedge until NIFTY approaches 24,900. Their collective short-call positioning creates structural selling above 25,000 and contributes to the suppression of any recovery rally; even a strong recovery will face institutional resistance well before 25,000, making the CPR band at 24,637–24,641 the far more relevant intraday resistance in this scenario. |
🟢 OI-S: **OI-S at 24,000 PE** is the primary bear target and PUT monetisation zone — the heavy concentration of PE open interest at this strike means that any sustained move toward 24,000 triggers aggressive put buying and straddle monetisation by sophisticated traders. In a significant or large gap-down scenario, 24,000 acts as a self-fulfilling gravitational target if the L3–L4 zone (24,615.95–24,595.91) fails to hold, and PE writers at 24,000 will begin unwinding (buying back puts) as spot approaches, creating a technical bounce near that zone. |
⚡ Key Trigger: The key trigger in a gap-down scenario is **failure to reclaim BC 24,637.54 within the first 30 minutes of trading** — as long as NIFTY trades below BC 24,637.54, the bearish thesis is intact and every recovery attempt toward the CPR should be treated as a shorting opportunity rather than a reversal. The bull trigger, conversely, is a **30-minute candle close above TC 24,640.60**, which, if achieved, flips the CPR band from resistance to support and restores the bullish structure with H3 24,656.05 as the first recovery target.
◆ Near Flat Open — Open ≈ Prev Close (±0.05%)
◆ Neutral
Open lands: A ±0.05% flat open from prev close 24,636.00 places NIFTY in the range of 24,623.68–24,648.32. Given the Ascending Narrow CPR with BC at 24,637.54 and TC at 24,640.60, a flat open is essentially INSIDE the CPR band itself — the open lands directly on or within the 3-point CPR band, which is an extraordinarily compressed information-rich setup.
CPR role: Decision zone and compression band — the CPR width of just 3.06 points (BC 24,637.54 to TC 24,640.60, width 0.01%) means the entire day’s directional structure will be determined by which side of this micro-band price commits to in the first 15 minutes. This is the archetypal narrow CPR setup that produces high-probability trending days.
Near Flat (±0.05%)
A flat open directly inside the Ascending Narrow CPR (BC 24,637.54 — TC 24,640.60, width 0.01%) is one of the highest-probability trending day setups in technical analysis — when a narrow ascending CPR is tested from the inside at the open, the first 15-minute candle’s direction almost always determines the full session trend, and traders should treat any indecision within this 3-point band as temporary before a decisive breakout. A 15-minute close above TC **24,640.60** immediately confirms bulls are in control; the CPR flips to intraday support, and the next targets become H3 24,656.05 (first partial), then the H4 24,676.09 — R1 24,673.99 — PDH 24,677.05 cluster as the primary resistance zone for the day. Conversely, a 15-minute close below BC **24,637.54** confirms bears have taken the initiative; the CPR flips to overhead resistance, and the downside path opens to L3 24,615.95, PDL 24,604.15, and the S1 24,601.09 — L4 24,595.91 cluster as the first bear targets. The Trending market structure designation (not range-bound) further elevates the probability of a clean directional break rather than a chop day — narrow CPR + trending structure = do not fade the first confirmed break; instead, trail positions using the CPR as the base stop, and use the straddle-implied move of **249.85 points** (upper bound ~24,900, lower bound ~24,400) as the day’s statistical outer boundary.
|
▲ Upside Path → OI-R
Bull trigger above TC 24,640.60 sets the path to **H3 24,656.05** (Camarilla mean-reversion resistance, first partial profit — take 30–40% of position here), then the dense resistance cluster of H4 24,676.09 — R1 24,673.99 — PDH 24,677.05 (secondary partial profit, this is the highest probability reversal zone for the day given max pain at 24,600 pulling price lower), and beyond that H5 24,699.50 — H6 24,708.99 — R2 24,711.97 as trail targets. The OI-R wall at **25,000 CE** is the macro upside ceiling and should be used as the final exit target for any surviving swing portion of the trade — CE writing at 25,000 creates structural resistance that caps all but the most extraordinary rallies. |
▼ Downside Path → OI-S
Bear trigger below BC 24,637.54 opens the path to **L3 24,615.95** (Camarilla mean-reversion support, first partial cover on shorts), then PDL 24,604.15 — S1 24,601.09 — L4 24,595.91 (the breakdown cluster, secondary partial cover, and watch for volume acceleration as retail stops below PDL 24,604.15 are triggered), and extending to L5 24,572.50 — S2 24,566.17 as the day’s extended bear target. The OI-S floor at **24,000 PE** is the macro downside anchor — it is 636 points below the open and will not be reached intraday, but its existence means put writers will aggressively defend the 24,500–24,400 zone, creating a natural floor for any deep intraday flush. |
|
🔴 OI-R: In a flat-open scenario, **OI-R at 25,000 CE** serves as the ultimate upside ceiling that CE writers will defend with increasing delta hedging as spot prices rise — even though it is 364 points above the CPR band, its existence suppresses bullish enthusiasm and creates a psychological resistance that prevents traders from chasing breakouts above R3 24,746.89. The CE OI concentration at 25,000 also means that on any intraday rally, call premiums compress as price moves away from 25,000 (favorable for call sellers), reducing the incentive for fresh institutional long positions above 24,750. |
🟢 OI-S: The **OI-S at 24,000 PE** provides a strong psychological and structural floor in the flat-open scenario — the massive put writing at 24,000 signals institutional conviction that the index will remain above this level through the weekly and monthly expiry, creating a ‘safety net’ that prevents extreme bearish positioning. In the flat-open context, 24,000 PE’s role is to anchor the downside bias — traders know that any intraday move toward 24,200–24,300 will face aggressive put covering (buying back) by institutions, creating a natural demand zone that limits the effectiveness of aggressive short positions below the L4–L5 zone. |
⚡ Key Trigger: The structural fulcrum is the **first 15-minute candle close above TC 24,640.60 (bull) or below BC 24,637.54 (bear)** — given the CPR width is only 3.06 points, this trigger fires early and decisively, and the Narrow confirmation rule mandates action on the first 15-minute bar rather than waiting for a 30-minute close. Market psychology driving this is straightforward: institutional algorithms set to trigger on either side of the CPR band will generate a cascade of orders once price commits, and the lack of CPR width means there is no ‘middle ground’ where price can dawdle — the moment the band is breached, momentum builds rapidly.
BANKNIFTY
Ascending — Medium (Width: 0.19%)
▲ Bullish
|
Market Structure
Balanced or transitional |
Straddle
ATM 58,100 monthly straddle = **1,315.65 pts** (Call 698.4 + Put 617.25), implying a substantial expected move of roughly ±657 pts from ATM for the monthly series. For intraday context, a reasonable daily attribution of this premium suggests BANKNIFTY can move 200–350 points in a single session, making the CPR band width of 111.92 points (BC 57,895.77 to TC 58,007.69) a meaningful intraday structure rather than a minor filter. |
Max Pain
Monthly max pain at **58,000** — just 63.65 points below yesterday’s close of 58,063.65. This is an extremely tight max pain reading relative to spot, indicating that option sellers on the monthly series are most exposed near current levels, and any drift below 58,000 activates put sellers’ losses while a hold above 58,000 is the path of least resistance for the options market. The OI-S at 58,000 PE directly aligns with this max pain level, creating a double-confirmation support zone. |
Tomorrow’s Complete Level Map
OI-R: 59,000 R3: 58,550.91 H6: 58,427.99 H5: 58,379.15 R2: 58,313.88 H4 ▶: 58,262.83 R1: 58,188.76 PDH: 58,076.85 H3 ↩: 58,163.24
TC: 58,007.69 P: 57,951.73 BC: 57,895.77
L3 ↩: 57,964.06 PDL: 57,714.70 S1: 57,826.61 L4 ▶: 57,864.47 S2: 57,589.58 L5: 57,748.15 L6: 57,699.31 S3: 57,464.46 OI-S: 58,000
↩ = Camarilla reversal point | ▶ = Camarilla breakout/breakdown trigger | OI-R/OI-S = Options wall (CE/PE max OI)
▲ Higher Open (Gap Up) — Open > Prev Close
▲ Bullish
Open lands: With an Ascending CPR where BC (57,895.77) sits well below prev_close (58,063.65) and TC (58,007.69) is also below prev_close, a gap-up open from 58,063.65 places price ABOVE the entire CPR band. The gap-up confirms price is above TC 58,007.69, making the CPR band a support structure below the open rather than a contested zone — this is the cleanest bullish configuration for an Ascending Medium CPR.
CPR role: Support band / launch pad — the CPR band (BC 57,895.77 to TC 58,007.69) is entirely below the gap-up open and functions as a multi-level support structure. Any pullback that holds above TC 58,007.69 on a 30-minute close confirms structural bullishness, while a deeper pullback testing BC 57,895.77 is a critical support test.
Minor Gap (0.05–0.25%) — Structure Dominant
A minor gap up of 0.05–0.25% opens BANKNIFTY in the range of approximately 58,093–58,208, placing price above both TC 58,007.69 and the previous day’s high of 58,076.85 at the higher end — a significant immediate signal given PDH represents yesterday’s intraday peak resistance. The Ascending Medium CPR adds directional confirmation, but at 0.19% width, the Medium confirmation rule requires a **30-minute close** above TC 58,007.69 before treating the move as confirmed; this is especially important given the ‘Balanced or transitional’ market structure, which implies that false breakouts are more common than in a purely trending environment. From the open, the first target is H3 58,163.24 (Camarilla mean-reversion resistance), followed by R1 58,188.76 (traditional first target, first partial profit area), and then H4 58,262.83 — a 30-minute close above PDH 58,076.85 with volume is the specific trigger that unlocks the path to this cluster.
Significant Gap (0.25–0.5%) — Balanced
A significant gap up of 0.25–0.50% opens BANKNIFTY in the range of approximately 58,208–58,353, placing price directly inside the H4 58,262.83 — R2 58,313.88 zone at the open — meaning the market is already pricing in a substantial portion of the upside target in the overnight session. Gap-fill risk is elevated here: the CPR band is 200–350 points below the open, and the first natural pullback support is H3 58,163.24 — R1 58,188.76, which becomes the ‘gap stabilisation zone’ — if this area holds on the first 30-minute pullback, the bull case extends to H5 58,379.15 and R3 58,550.91. Delta hedging by CE writers at 59,000 begins to accelerate as BANKNIFTY approaches 58,400–58,500, creating increasing headwinds for the rally above H5 58,379.15.
Large Gap (>0.5%) — Gap Direction Dominant
A large gap up of over 0.50% opens BANKNIFTY above 58,353, potentially near H5 58,379.15 or above, pushing price into the upper Camarilla target zone at the open and raising the probability of mean-reversion selling as overnight longs book profits. The straddle-implied monthly move of 1,315.65 points is wide enough to accommodate this gap without statistically exhausting the move, but the ‘Balanced or transitional’ market structure warrants caution — large gap opens in transitional markets have higher gap-fill rates than in trending markets. Target zones on extension are H5 58,379.15 — H6 58,427.99 — R3 58,550.91, with the OI-R wall at **59,000 CE** as the ultimate ceiling; on a gap-fill, H4 58,262.83 is the first support before TC 58,007.69 becomes the crucial line of defence.
|
▲ Upside Path → OI-R
From above PDH 58,076.85, the confirmed upside path progresses to **H3 58,163.24** (Camarilla mean-reversion resistance, first partial profit — watch for selling at this level from range traders), then **R1 58,188.76** (traditional first target, second partial), and into the **H4 58,262.83 — R2 58,313.88** breakout zone (Camarilla breakout trigger, trail stop here). Extended targets are **H5 58,379.15 — H6 58,427.99 — R3 58,550.91**, with the OI-R wall at **59,000 CE** as the session ceiling — CE writers at 59,000 will aggressively sell delta as spot approaches 58,700–58,900, making that zone the maximum realistic intraday extension. |
▼ Downside Path → OI-S
A gap-up failure that closes the first 30-minute bar below TC **58,007.69** shifts the structural bias to neutral and triggers a CPR retest — below TC, the Pivot 57,951.73 and BC 57,895.77 are the next support references, and a 30-minute close below BC 57,895.77 converts the CPR into resistance and opens the bear path. Below BC 57,895.77, the downside path moves to **L3 57,964.06** (note: L3 is above BC in this dataset — derived from Camarilla formula; acts as first intraday pullback reference), then **L4 57,864.47** — **S1 57,826.61** (PDL range support and traditional first downside target), and ultimately **L5 57,748.15** — PDL **57,714.70** as the extended bear target, with OI-S at **58,000 PE** acting as a crucial support floor that has significant put writing defending it. |
|
🔴 OI-R: The **OI-R at 59,000 CE** represents the dominant call option open interest level for the BANKNIFTY monthly series — institutional CE writers at 59,000 have sold a massive volume of calls, creating gamma pressure that intensifies as spot approaches 58,700–58,900 (where delta hedging becomes mechanical). In a gap-up scenario, 59,000 is approximately 936 points above the previous close, making it a session-end target only on exceptionally strong days — its primary intraday role is as a psychological and structural ceiling that prevents institutional long positioning above 58,500. |
🟢 OI-S: The **OI-S at 58,000 PE** is the critical intraday support level in the gap-up scenario, aligning perfectly with the monthly max pain at 58,000 and creating a double-validation support zone just 63.65 points below prev close. In a gap-up that subsequently reverses, 58,000 PE is where institutional put writers (who have sold puts at this strike) will aggressively defend by buying futures — this creates a mechanical support that makes any test of 58,000 from above a high-probability bounce zone and the ideal entry for recovery longs. |
⚡ Key Trigger: The key trigger in the gap-up scenario for BANKNIFTY (Medium CPR) is a **30-minute candle close above PDH 58,076.85** — this level combines the previous day’s high with the area just above TC 58,007.69 and represents the zone where fresh institutional buying (rather than overnight carry) enters the picture. If the 30-minute close holds above PDH 58,076.85 with above-average volume, the bias is confirmed bullish with H3 58,163.24 as the first target; a failure to close above PDH on the first 30-minute candle — especially if a wick forms below TC 58,007.69 — signals a gap-fade play with the CPR band as the next support test.
▼ Lower Open (Gap Down) — Open < Prev Close
▼ Bearish
Open lands: A gap-down open from prev close 58,063.65 in an Ascending CPR configuration places price below the prev close but potentially still above or inside the CPR band (BC 57,895.77 to TC 58,007.69). A minor gap down keeps price inside the CPR band, while a significant or large gap down breaks below BC 57,895.77 and places the entire CPR overhead as resistance.
CPR role: Battleground / recovery zone — the CPR band (BC 57,895.77 to TC 58,007.69) is a 112-point wide zone that can act as either a recovery support (if price opens inside) or overhead resistance (if price opens below BC). The 0.19% width means the band has genuine real estate that can contain early price action, but a Medium CPR in a ‘Balanced or transitional’ structure means neither bulls nor bears have a strong structural edge until a 30-minute close confirms direction.
Minor Gap (0.05–0.25%) — Structure Dominant
A minor gap down of 0.05–0.25% opens BANKNIFTY in the range of approximately 57,918–58,034, placing price inside the CPR band (BC 57,895.77 to TC 58,007.69) — this is an inside-CPR gap-down scenario where price opens in the neutral zone. The 30-minute rule for Medium CPR requires a close above TC 58,007.69 to confirm bullish recovery or a close below BC 57,895.77 to confirm bearish breakdown; inside-CPR movement for the first 30 minutes is noise and should not be traded aggressively. A close below BC 57,895.77 on the first 30-minute bar opens the downside path to L4 57,864.47 — S1 57,826.61 as the first bear target, while a reclaim of TC 58,007.69 targets H3 58,163.24 and PDH 58,076.85 as the recovery trajectory.
Significant Gap (0.25–0.5%) — Balanced
A significant gap down of 0.25–0.50% opens BANKNIFTY in the range of approximately 57,772–57,918, placing price below BC 57,895.77 (at the lower end) or inside the CPR band (at the higher end), meaning the entire CPR band transitions to overhead resistance in the significant gap scenario. The critical level to monitor is BC 57,895.77 — if price opens below this and fails to reclaim it within two 30-minute closes (the Wide rule applies when price breaks below CPR), the bear path to L4 57,864.47 — L5 57,748.15 — PDL 57,714.70 — S2 57,589.58 is open. The OI-S at 58,000 PE (63.65 points above prev close) becomes the immediate overhead reference in this scenario — put writers at 58,000 will defend aggressively, so any close below 58,000 is a significant bear signal that could accelerate the move to S2 57,589.58.
Large Gap (>0.5%) — Gap Direction Dominant
A large gap down of over 0.50% opens BANKNIFTY below 57,772, breaching PDL 57,714.70 potential and placing price near or below L5 57,748.15 — L6 57,699.31, which is a significant technical event given the monthly max pain is at 58,000, now 350+ points overhead. This scenario triggers panic selling and would likely see VIX spike (unavailable but assumed elevated), with the straddle’s 1,315.65 point monthly range being rapidly consumed on the downside — put options bought at ATM would appreciate sharply, and the optimal strategy is to monetise put longs near S2 57,589.58 — S3 57,464.46 rather than waiting for full gap-fill. Recovery scenario requires reclaiming PDL 57,714.70 with a strong 30-minute candle, then BC 57,895.77 — the CPR band must be reclaimed within the session for any bull thesis to be credible.
|
▲ Upside Path → OI-R
The gap-down recovery path starts with reclaiming **BC 57,895.77** (first 30-minute close above converts CPR to support from below), then **Pivot 57,951.73** (midpoint confirmation), and finally **TC 58,007.69** (full CPR reclaim restores bullish structure). Beyond the CPR, **PDH 58,076.85** and then **H3 58,163.24 — R1 58,188.76** are the recovery targets; a genuine reversal (not dead-cat) is confirmed by the second 30-minute close above TC 58,007.69 with volume above the 30-day average. |
▼ Downside Path → OI-S
Below BC 57,895.77, the bear path progresses to **L3 57,964.06** (note: in this CPR configuration, L3 is within the CPR band range; the effective first external downside reference is **L4 57,864.47**), then **S1 57,826.61** (traditional first downside target, partial short cover here), and into **L5 57,748.15 — PDL 57,714.70** (major intraday support, retail stops cluster here causing acceleration through this zone). Below PDL 57,714.70, **L6 57,699.31 — S2 57,589.58** is the extended bear target, with **OI-S 58,000 PE** having already been lost overhead — once 58,000 is definitively lost, put option monetisation is the preferred strategy. |
|
🔴 OI-R: In a gap-down scenario, **OI-R at 59,000 CE** is structurally distant and irrelevant for intraday trading — CE writers at 59,000 are well protected and have no reason to hedge until BANKNIFTY recovers above 58,500. The real overhead resistance in this scenario is the CPR band itself (BC 57,895.77 to TC 58,007.69) combined with PDH 58,076.85, which collectively form a 181-point resistance zone that must be cleared before CE writers at 59,000 become relevant again. |
🟢 OI-S: The **OI-S at 58,000 PE** is the single most important level in the gap-down scenario — it sits only 63.65 points below prev close and aligns exactly with the monthly max pain at 58,000, meaning put writers have heavily sold the 58,000 PE and will defend this level mechanically through futures buying as spot approaches. A close below 58,000 on any 30-minute bar is a high-conviction bear signal because it means put writers are losing their positions and forced selling accelerates; conversely, a bounce from 58,000 is extremely reliable and should be faded into the CPR band recovery. |
⚡ Key Trigger: The key trigger in BANKNIFTY’s gap-down scenario is **failure to reclaim TC 58,007.69 within two 30-minute closes** (Medium CPR rule) — this is the structural fulcrum because TC 58,007.69 represents the top of the ascending CPR band, and until bulls reclaim this level with a closing conviction, the entire 112-point CPR band acts as overhead resistance compounding bearish pressure. The bull recovery trigger is specifically a **two consecutive 30-minute close above TC 58,007.69**, which resets the CPR to support and restores the bullish bias with PDH 58,076.85 as the first recovery milestone.
◆ Near Flat Open — Open ≈ Prev Close (±0.05%)
◆ Neutral
Open lands: A ±0.05% flat open from prev close 58,063.65 places BANKNIFTY in the range of 57,834.73–58,092.57. Given TC is at 58,007.69 and BC is at 57,895.77, a flat open at +0.05% (58,092.57) places price marginally above TC, while a flat open at -0.05% (57,834.73) places price below BC — meaning the flat open for BANKNIFTY can land either above TC, inside the CPR, or below BC depending on the exact gap level.
CPR role: Decision zone — the 112-point CPR band (BC 57,895.77 to TC 58,007.69) is wide enough to contain early price action and creates a genuine battleground where the first 30 minutes of trading determines the session’s directional bias. In the ‘Balanced or transitional’ market structure, this CPR acts as a pivot — price above TC is bullish territory, price below BC is bearish territory, and price inside the band is transitional with no actionable edge until confirmed by a 30-minute close.
Near Flat (±0.05%)
A flat open in the BANKNIFTY Ascending Medium CPR context is a nuanced setup — the 112-point CPR band (BC 57,895.77 to TC 58,007.69) means price can open at different positions within this range, but the Medium CPR rules require a **30-minute close** above TC 58,007.69 or below BC 57,895.77 for a directional trade, making the first 30 minutes an observation-only period for disciplined traders. If price opens above TC 58,007.69 (flat at +0.05% level of 58,092.57), the CPR immediately functions as support below, and a 30-minute hold above TC confirms the bull case with PDH 58,076.85 as the first intraday milestone and H3 58,163.24 as the primary session target — traders should watch whether PDH 58,076.85 is tested and holds before the 30-minute candle closes. If price opens inside the CPR band or below BC 57,895.77 (flat at -0.05% level of ~57,834), the bearish configuration activates immediately with the entire CPR band as overhead resistance, and L4 57,864.47 — S1 57,826.61 as the first downside references — a 30-minute close below BC 57,895.77 confirms the bear leg. The ‘Balanced or transitional’ market structure is the critical qualifier here — unlike a pure trending setup, transitional markets have a higher probability of CPR band retests after initial breaks, so even after a confirmed 30-minute close above TC 58,007.69, traders should anticipate at least one retest of the CPR band before the second leg up toward H4 58,262.83 — R2 58,313.88.
|
▲ Upside Path → OI-R
Bull trigger above TC **58,007.69** (30-minute close) projects the upside path to **PDH 58,076.85** (immediate test of previous day’s high — first confirmation that bulls have fresh momentum), then **H3 58,163.24** (Camarilla resistance, first partial profit), **R1 58,188.76** (traditional first target, second partial), and the **H4 58,262.83 — R2 58,313.88** breakout zone as the primary session target. The OI-R at **59,000 CE** is the macro ceiling — 937 points above the flat open — and requires extraordinary sustained momentum to approach intraday. |
▼ Downside Path → OI-S
Bear trigger below BC **57,895.77** (30-minute close) opens the downside path to **L4 57,864.47** (Camarilla breakdown trigger, first intraday bear target), **S1 57,826.61** (traditional first downside target, partial short cover), and **L5 57,748.15 — PDL 57,714.70** (Camarilla downside extension and previous day’s low, major support where retail stops accelerate the move). The OI-S at **58,000 PE** (already lost if below BC 57,895.77) transitions from support to overhead resistance, reinforcing the bear structure and making any bounce toward 58,000 a fade opportunity. |
|
🔴 OI-R: In the flat-open scenario, **OI-R at 59,000 CE** acts as the distant macro ceiling that CE writers will protect — but its primary intraday relevance is that it creates a 937-point theoretical upside from the flat open, which combined with the 1,315.65 monthly straddle, means the market is pricing in room for a significant move. CE writers at 59,000 will begin incremental delta hedging as BANKNIFTY crosses 58,500, creating a slowdown in rally momentum well before the 59,000 OI wall is reached — traders should use H5 58,379.15 and R3 58,550.91 as practical upside limits for the session. |
🟢 OI-S: The **OI-S at 58,000 PE** has an exceptional role in the flat-open scenario because it sits inside the CPR band itself — between BC 57,895.77 and TC 58,007.69 — meaning the CPR band and the OI support level are effectively merged into one zone. This double-confluence (CPR band + PE max OI) at the 57,895.77–58,007.69 range makes it the single most important intraday support reference, and put writers at 58,000 will mechanically buy futures to defend their positions, creating a strong bounce tendency from this zone on any intraday test from above. |
⚡ Key Trigger: The structural trigger for BANKNIFTY flat open is a **30-minute candle close above TC 58,007.69** (bull) or a **30-minute candle close below BC 57,895.77** (bear) — the 112-point band creates genuine uncertainty in the first 30 minutes, and the ‘Balanced or transitional’ market structure means that fake breaks within the band are common, making the 30-minute rule (not 15-minute) mandatory for this setup. The specific psychological driver is the OI-S at 58,000 PE sitting inside the CPR band (58,000 is between BC 57,895.77 and TC 58,007.69) — this creates a magnetic pull toward 58,000 in the early session, and whichever side decisively clears this level on a 30-minute close has the structural advantage for the day.
SENSEX
Ascending — Medium (Width: 0.14%)
▲ Bullish
|
Market Structure
Balanced or transitional |
Straddle
ATM 79,000 monthly straddle = **1,714.3 pts** (Call 974.3 + Put 740.0), implying a large expected monthly move of roughly ±857 pts. However, the weekly straddle at ATM 79,000 shows Call 0.05 + Put 45.15 = **45.2 pts**, which is an extraordinarily small weekly straddle — indicating that SENSEX weekly options are deeply in-the-money or near-expiry and that the weekly expected move has been largely consumed. The asymmetry (put 45.15 >> call 0.05) in the weekly straddle strongly suggests the 79,000 call has expired worthless or near-worthless, confirming heavy resistance at this level. |
Max Pain
SENSEX weekly max pain at **78,900** and monthly max pain at **78,700** — the weekly max pain aligns precisely with the OI-S at 78,900 PE, creating a powerful double-confirmation support zone. The monthly max pain at 78,700 is 254.76 points below the previous close of 78,954.76, suggesting that on a monthly basis, option sellers are comfortable with SENSEX drifting slightly lower from current levels — this creates a mild gravitational pull toward 78,700–78,900 over the coming weeks. |
Tomorrow’s Complete Level Map
OI-R: 79,000 R3: 79,382.80 H6: 79,277.10 H5: 79,234.45 R2: 79,168.78 H4 ▶: 79,131.33 R1: 79,061.77 PDH: 78,954.76 H3 ↩: 79,043.04
TC: 78,901.26 P: 78,847.75 BC: 78,794.24
L3 ↩: 78,866.48 PDL: 78,633.73 S1: 78,740.74 L4 ▶: 78,778.19 S2: 78,526.72 L5: 78,675.07 L6: 78,632.42 S3: 78,419.71 OI-S: 78,900
↩ = Camarilla reversal point | ▶ = Camarilla breakout/breakdown trigger | OI-R/OI-S = Options wall (CE/PE max OI)
▲ Higher Open (Gap Up) — Open > Prev Close
↕ Conflicted
Open lands: With an Ascending CPR where BC (78,794.24) and TC (78,901.26) are both below prev_close (78,954.76), a gap-up open from 78,954.76 places price above TC 78,901.26 and PDH 78,954.76 — the entire CPR band is below the open. This is an important configuration: SENSEX closed at the PDH (which was also the day’s close), meaning any gap-up opens above the all-day high of the previous session.
CPR role: Support band — the CPR band (BC 78,794.24 to TC 78,901.26) sits 53–160 points below a gap-up open and acts as tiered support. However, given that OI-R at 79,000 CE and OI-S at 78,900 PE create a razor-thin 100-point OI channel, the gap-up open above 78,954.76 immediately puts price inside this critical OI zone, creating intense two-sided pressure.
Minor Gap (0.05–0.25%) — Structure Dominant
A minor gap up of 0.05–0.25% opens SENSEX in the range of approximately 78,994–79,151, placing price directly inside or above the critical **OI-R zone at 79,000 CE** — this is the most information-rich opening scenario because the index opens at or through the largest CE OI strike. The weekly straddle at 79,000 shows a call premium of only **0.05 points** (near-zero), confirming that 79,000 CE has been almost fully defended and any sustained trade above 79,000 on 07 Aug will cause significant gamma squeeze from CE writers needing to buy futures for delta hedging. The first 30-minute candle above 79,000 is the trigger for extension to H3 79,043.04 — R1 79,061.77, while rejection below 79,000 brings TC 78,901.26 and L3 78,866.48 — OI-S 78,900 PE into play as the support base.
Significant Gap (0.25–0.5%) — Balanced
A significant gap up of 0.25–0.50% opens SENSEX in the range of approximately 79,151–79,349, placing price above H4 79,131.33 and approaching H5 79,234.45 — R3 79,382.80 territory at the open, meaning the market is gapping above most of the day’s Camarilla upside targets before trading even begins. Gap-fill risk here is high — price is opening well above the OI-R at 79,000 CE, which will now act as support on any pullback (call writers flipping from resistance-at-OI to support-at-reclaim), and the gap-fill target is 79,000 — TC 78,901.26 — OI-S 78,900 as a cascading support structure. Fresh longs above H5 79,234.45 should use tight stops as the monthly straddle’s remaining premium is being rapidly consumed by this gap.
Large Gap (>0.5%) — Gap Direction Dominant
A large gap up of over 0.50% opens SENSEX above 79,349, placing price at or above H6 79,277.10 — R3 79,382.80 and potentially testing the weekly OI resistance ceiling. This is an extreme scenario where the straddle-implied monthly move of 1,714.3 points is being consumed rapidly, and mean-reversion selling by institutions (who sold the monthly 79,000 CE straddle) will be aggressive. The abort level for any gap-up long position is a two 30-minute close below H5 79,234.45, and the gap-fill target is 79,000 (OI-R converted to support) then TC 78,901.26 — OI-S 78,900 PE as the base.
|
▲ Upside Path → OI-R
Sustained above OI-R 79,000 (30-minute close), the upside path progresses to **H3 79,043.04** (Camarilla first resistance, partial profit), **R1 79,061.77** (traditional first target, second partial), **H4 79,131.33** (Camarilla breakout trigger, trail stop), and into **H5 79,234.45 — H6 79,277.10 — R2 79,168.78** (upper Camarilla target zone and traditional second target). The **OI-R at 79,000 CE** itself, once sustainably cleared, becomes the session’s most important support reference — CE writers who are forced to cover above 79,000 create a floor that makes pullbacks to 79,000 buyable. |
▼ Downside Path → OI-S
A gap-up failure below OI-R **79,000** reverts back to TC **78,901.26** — **OI-S 78,900 PE** as the first support test (note the remarkable 1.26-point overlap between TC and OI-S, creating a near-perfect support cluster). Below this cluster, **L3 78,866.48** is the Camarilla mean-reversion support, followed by **L4 78,778.19 — S1 78,740.74** as the breakdown zone, and **L5 78,675.07 — PDL 78,633.73 — L6 78,632.42** as the extended bear target if the L4 cluster fails. |
|
🔴 OI-R: The **OI-R at 79,000 CE** is the most critical single level in SENSEX analysis — the weekly call at 79,000 has a premium of only **0.05 points**, meaning CE writers have already won their short-call bet and the strike is essentially at its terminal value. In a gap-up scenario, 79,000 transitions from a ceiling (where it was for the past week) to a gamma activation zone — any sustained trade above 79,000 forces CE writers to buy SENSEX futures for delta neutrality, creating a sharp self-reinforcing rally that has historically produced powerful breakout days; conversely, rejection at 79,000 after a gap is a clean fade setup. |
🟢 OI-S: The **OI-S at 78,900 PE** in a gap-up scenario is the primary gap-fill support reference — it overlaps almost perfectly with TC 78,901.26, creating a 1.26-point double-confluence support zone. Put writers at 78,900 have sold puts aggressively and will buy SENSEX futures to defend this level on any intraday pullback from above, making the 78,900–78,901 zone a high-probability bounce point that should be treated as the abort level for any gap-up long — a close below 78,900 on a 30-minute bar invalidates the gap-up thesis. |
⚡ Key Trigger: The single most important trigger for SENSEX gap-up is **whether the first 30-minute candle sustains above OI-R at 79,000** — given the weekly call premium at 79,000 is only 0.05 points (effectively expired), any sustained trade above 79,000 creates acute gamma pressure for CE writers who must buy SENSEX futures to delta-hedge, creating a self-reinforcing momentum surge. Failure to hold 79,000 on the 30-minute close converts this level back to resistance and opens the gap-fill path to TC **78,901.26** — OI-S **78,900** PE, which forms a near-perfect overlap and acts as the session’s most critical support zone.
▼ Lower Open (Gap Down) — Open < Prev Close
▼ Bearish
Open lands: A gap-down open from prev close 78,954.76 in an Ascending CPR configuration places price below the previous close but potentially inside or below the CPR band (BC 78,794.24 to TC 78,901.26). A minor gap down opens inside the CPR, a significant gap down may breach BC 78,794.24, and a large gap down places price below the CPR entirely. Note that prev close 78,954.76 was also the PDH (session closed at the high), making any gap down a bearish opening relative to the day’s trend.
CPR role: Overhead resistance / battleground — in a gap-down scenario, the CPR band (BC 78,794.24 to TC 78,901.26) and the critical OI-S 78,900 PE overlap zone (TC 78,901.26 ≈ OI-S 78,900) create a formidable combined resistance-support structure. Price opening below TC 78,901.26 means OI-S and TC are now overhead, and the CPR band must be reclaimed from below — a challenging task given the ‘Balanced or transitional’ market structure.
Minor Gap (0.05–0.25%) — Structure Dominant
A minor gap down of 0.05–0.25% opens SENSEX in the range of approximately 78,758–78,915, placing price inside the CPR band (BC 78,794.24 to TC 78,901.26) or marginally below BC 78,794.24 — importantly, a minor gap down places price at or through the critical OI-S at **78,900 PE** and TC 78,901.26 cluster at the open. The CPR band’s 30-minute confirmation rule applies — a 30-minute close above TC 78,901.26 (which also confirms OI-S 78,900 as a floor held) is the bull recovery trigger, while a 30-minute close below BC 78,794.24 confirms the bear leg with L3 78,866.48 — L4 78,778.19 — S1 78,740.74 as the downside path. Minor gaps opening below OI-S 78,900 are high-alert scenarios because put writers at 78,900 begin loss-making below this level and their delta hedging (futures selling) accelerates the downside — a 30-minute hold above 78,900 is crucial to prevent a cascade.
Significant Gap (0.25–0.5%) — Balanced
A significant gap down of 0.25–0.50% opens SENSEX in the range of approximately 78,758–78,757, breaching BC 78,794.24 and L4 78,778.19 — S1 78,740.74 zone on the downside, placing both the CPR band and the OI-S 78,900 PE entirely overhead as resistance. The two 30-minute close rule for Medium CPR confirmation means the first 60 minutes are crucial — failure to reclaim BC 78,794.24 within two 30-minute candles confirms bear control with S1 78,740.74 — L4 78,778.19 — L5 78,675.07 as the progressive downside targets. Put writers at 78,900 PE who are now deeply in-the-money will continue futures hedging (selling), creating a self-reinforcing bear loop that targets the weekly max pain at **78,900** — which is already breached — and then the monthly max pain at **78,700**, making S2 78,526.72 — L5 78,675.07 zone the most likely destination.
Large Gap (>0.5%) — Gap Direction Dominant
A large gap down of over 0.50% opens SENSEX below 78,558, breaching L5 78,675.07 and potentially opening near S2 78,526.72 — L6 78,632.42 zone — a scenario that would likely cause significant damage to the options market given the weekly straddle’s remaining value (45.2 points total) would be entirely consumed in this single move. This scenario would validate full put monetisation — the 79,000 put held from yesterday would be worth the full 45.2 points of straddle premium plus additional intrinsic value, and traders should focus on closing long puts near S2 78,526.72 — S3 78,419.71. Recovery levels are BC 78,794.24 (requires 100+ point intraday rally from the open) and TC 78,901.26 — OI-S 78,900 (requires 350+ point recovery) — both extreme bars in a large gap-down environment.
|
▲ Upside Path → OI-R
Gap-down recovery path from inside the CPR: reclaim **TC 78,901.26** (also OI-S 78,900 reclaim, 30-minute close needed) to confirm floor, then target **PDH 78,954.76** (previous close and session high, key recovery milestone), and beyond that **H3 79,043.04 — R1 79,061.77** as bullish extension targets. A genuine recovery (not dead-cat) requires volume above the 30-minute average on the reclaim candle above TC 78,901.26 — anything less is a trap that reverses toward S1 78,740.74. |
▼ Downside Path → OI-S
Below BC **78,794.24** (30-minute close), the path moves through **L4 78,778.19** (Camarilla breakdown trigger) and **S1 78,740.74** (traditional first downside target, partial short cover here), then into **L5 78,675.07 — PDL 78,633.73 — L6 78,632.42** (major intraday support cluster where multiple Camarilla levels and the previous day low converge — high probability bounce zone for scalp recovery). The OI-S at **78,900 PE** is now overhead and the monthly max pain at **78,700** is the gravitational target that put option dynamics will pull toward over the coming sessions. |
|
🔴 OI-R: In a gap-down scenario, **OI-R at 79,000 CE** has a weekly premium of only 0.05 points — it is structurally irrelevant for intraday upside in a gap-down situation, as CE writers at 79,000 have no delta exposure to hedge and will not add momentum in either direction. Its only relevance is as the macro upper reference — any recovery above 79,000 CE from a gap-down starting point would be an extraordinary reversal that exhausts selling and triggers a gamma squeeze from the small residual open interest. |
🟢 OI-S: The **OI-S at 78,900 PE** is the single most important level in SENSEX gap-down analysis — its 1.26-point overlap with TC 78,901.26 creates a structural dual-validation support that, if lost on a 30-minute close, triggers put writer delta hedging (futures selling) and accelerates the bear move to S1 78,740.74. PE writers at 78,900 are now in-the-money on a gap-down, which means the intensity of their hedging activity increases as spot moves further below 78,900 — this is a self-reinforcing bearish dynamic that makes the 78,900 area the single ‘make-or-break’ level for the entire session. |
⚡ Key Trigger: The most critical trigger in SENSEX gap-down is **whether the 30-minute close holds above OI-S 78,900 PE — TC 78,901.26** (the 1.26-point overlap creating a near-perfect level) — if SENSEX can close the first 30-minute bar above 78,901.26, put writers at 78,900 are protected and their buying pressure creates a natural floor from which recovery can build. The bear confirmation trigger is a **30-minute close below BC 78,794.24**, which definitively places the entire CPR band and OI-S 78,900 as overhead resistance and activates the downside path to L4 78,778.19 — S1 78,740.74 — L5 78,675.07.
◆ Near Flat Open — Open ≈ Prev Close (±0.05%)
◆ Neutral
Open lands: A ±0.05% flat open from prev close 78,954.76 places SENSEX in the range of 78,915.28–78,994.24. Given TC is at 78,901.26 and OI-R is at 79,000, a flat open places price in the critical 78,901–79,000 zone — between TC and OI-R, which is a 98.74-point zone that contains both the CPR top and the options wall ceiling. This is a compression zone between two major structural forces.
CPR role: Decision zone and compression band — price opening between TC 78,901.26 and OI-R 79,000 is trapped in a 98.74-point squeeze between CPR-top (bullish if held) and OI wall (ceiling if CE writers defend). The CPR band (BC 78,794.24 to TC 78,901.26) functions as support below the flat open, while OI-R 79,000 functions as the ceiling above — the first 30-minute candle determines which structure dominates.
Near Flat (±0.05%)
A flat open in SENSEX’s Ascending Medium CPR places price in the most critical zone of the entire level structure — between TC **78,901.26** and OI-R **79,000 CE**, a 98.74-point band that simultaneously represents the bullish launch zone (above TC = CPR support below) and the options wall ceiling (below 79,000 = CE writers maintaining the floor). The 30-minute confirmation rule for Medium CPR means that the first 30-minute candle close is the decisive trigger — a close above **79,000** (OI-R) with volume is the high-conviction bull signal, as it forces CE writers’ delta hedging and creates a self-reinforcing momentum burst toward H3 **79,043.04** — R1 **79,061.77**. A 30-minute close below TC **78,901.26** (which also breaches the OI-S at 78,900 PE overlap) immediately flips the CPR to overhead resistance and activates the bear path to L3 **78,866.48** — L4 **78,778.19** — S1 **78,740.74**. The ‘Balanced or transitional’ market structure means fake breaks of both the TC and 79,000 OI-R level are possible in the first 30 minutes — patience and the 30-minute close rule are mandatory, and the narrow weekly straddle of only **45.2 points** (Call 0.05 + Put 45.15) confirms that the weekly options market has largely priced in current levels, reducing the risk of a large random gap but also limiting the leverage from remaining weekly premiums.
|
▲ Upside Path → OI-R
Bull trigger with 30-minute close above **OI-R 79,000** opens the upside path to **H3 79,043.04** (Camarilla resistance, first partial), **R1 79,061.77** (traditional target, second partial), **H4 79,131.33** (Camarilla breakout trigger, trail stop to TC 78,901.26), and extended targets **H5 79,234.45 — H6 79,277.10 — R2 79,168.78**. The key confirmation signal for genuine momentum above 79,000 is volume — a 30-minute bar that closes above 79,000 with volume at least 1.5× the 30-day average confirms delta-hedging buying flow, while low-volume closes above 79,000 are likely false breakouts that should not be chased. |
▼ Downside Path → OI-S
Bear trigger with 30-minute close below TC **78,901.26** (OI-S 78,900 breach) opens the downside path to **L3 78,866.48** (Camarilla mean-reversion support, shallow pullback target), **L4 78,778.19 — S1 78,740.74** (Camarilla breakdown zone and traditional first target, primary bear target for the session), and extended to **L5 78,675.07 — L6 78,632.42 — PDL 78,633.73** (lower Camarilla targets and previous day’s low — a test of PDL 78,633.73 from above is the maximum realistic intraday downside in a flat-open session). The monthly max pain at **78,700** provides a gravitational pull toward L5 78,675.07 on any sustained break below the CPR. |
|
🔴 OI-R: In the flat-open scenario, the **OI-R at 79,000 CE** (weekly call premium 0.05 points) plays an unusual dual role — it is simultaneously the session ceiling (CE writers have already captured essentially all premium and will resist any further upside aggressively) and a potential gamma-squeeze trigger (the tiny residual premium means even a small move above 79,000 forces mechanical delta-hedging futures buying). For the flat-open scenario, 79,000 CE is the level to watch above all others — it is not just an OI wall but a live options market battleground that will determine the session’s character. |
🟢 OI-S: The **OI-S at 78,900 PE** in the flat-open scenario is the primary downside guardian — with weekly max pain at 78,900 and monthly max pain at 78,700 both below the open, put writers at 78,900 are actively defending their short-put positions through futures buying whenever spot approaches this level. The near-perfect overlap between OI-S 78,900 PE and TC **78,901.26** means that in a flat-open scenario, the CPR top and the OI support level are fused into a single level — this double-confluence makes 78,900–78,901 the strongest single support level in today’s SENSEX structure, and any 30-minute close below this zone is a high-conviction short trigger with S1 78,740.74 as the day’s primary downside target. |
⚡ Key Trigger: The dual structural trigger for SENSEX flat open is a **30-minute close above OI-R 79,000** (bull — forces CE delta-hedging gamma squeeze) or a **30-minute close below TC 78,901.26 and OI-S 78,900** (bear — activates put writer delta-hedging cascade). The reason this specific 99-point zone (78,901–79,000) is the fulcrum is that it contains BOTH the options market’s primary supply zone (79,000 CE) and the demand floor (78,900 PE) within a single day’s standard-deviation move, making the outcome of the first 30-minute candle a direct read on which side of the options market is winning the institutional battle for the session.
📊 VIX Insight: India VIX data is unavailable for this session, which is an unusual information gap that requires extra reliance on straddle-implied moves as surrogate volatility measures. The NIFTY weekly straddle of **249.85 points** and the SENSEX weekly straddle of just **45.2 points** (near-zero call premium at 79,000) suggest that weekly implied volatility is relatively contained and that major surprise moves are not being priced in by the options market for 07 Aug 2026 — however, the absence of VIX data means traders should be prepared for sharp intraday spikes if macro catalysts emerge, and should maintain wider-than-usual stops relative to normal low-VIX sessions.
Overall View:
For 07 Aug 2026, all three indices display Ascending CPR structures with NIFTY at an ultra-narrow 0.01% width (strongest trending day signal), BANKNIFTY at 0.19% Medium width with transitional market structure, and SENSEX at 0.14% Medium width also in transitional mode — collectively, the session leans bullish-to-neutral with NIFTY having the highest probability of a clean trending day while BANKNIFTY and SENSEX require 30-minute confirmation before directional commitment. The critical macro OI confluence to watch is SENSEX 79,000 CE (near-zero premium) vs 78,900 PE support, BANKNIFTY’s 58,000 OI-S aligning with monthly max pain, and NIFTY’s narrow CPR at 24,637–24,641 against the 25,000 CE macro ceiling — the day’s theme is that bulls hold a structural edge above their respective TC levels, but the ‘Balanced or transitional’ structure in BANKNIFTY and SENSEX demands disciplined confirmation before position-taking. Traders should prioritise the flat-open and minor gap-up scenarios as the highest-probability outcomes given the marginal previous day changes, use the first 15-minute rule for NIFTY and 30-minute rule for BANKNIFTY/SENSEX, and respect the OI walls at 25,000, 59,000, and 79,000 as the absolute intraday ceilings that should not be chased above without confirmed sustained closes.
This analysis is for educational purposes only and is not investment advice.


Responses