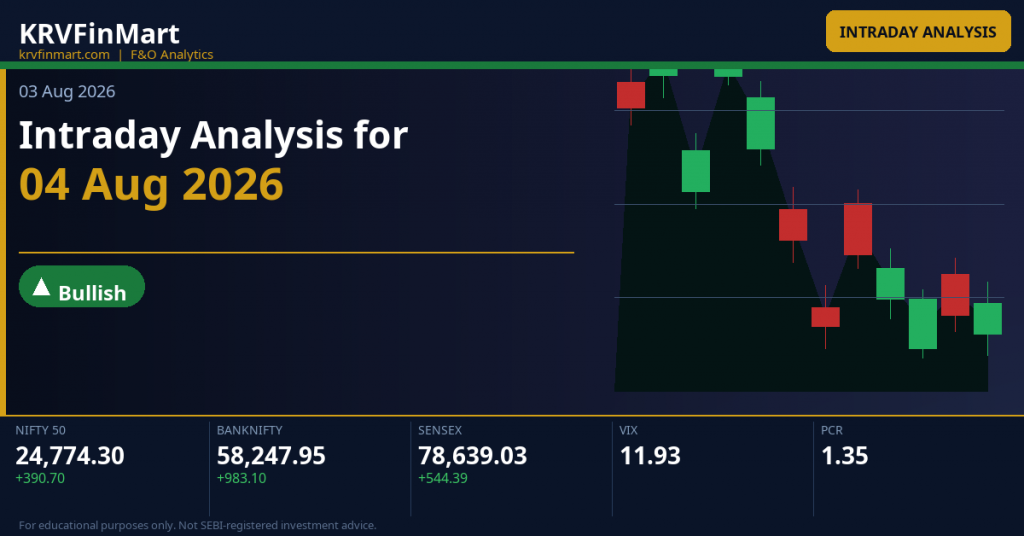
Intraday Analysis for 04 Aug 2026
Markets closed strongly on 03 Aug 2026, with NIFTY surging +1.60% to 24,774.30, BANKNIFTY adding +1.72% to close at 58,247.95, and SENSEX gaining +0.70% to 78,639.03, reflecting broad-based buying across large-caps and banking heavyweights. India VIX data is unavailable for this session, which limits precise premium-pricing and fear-gauge interpretation; traders should treat option premium decay and straddle levels as the primary volatility proxies for 04 Aug. The weekly straddle on NIFTY implies a move of just 185.75 points from ATM 24,750, signalling that the options market is pricing a relatively contained range for the expiry week, making level-to-level discipline and CPR structure adherence critical for intraday success.
All three indices closed at or near their day highs on 03 Aug, with ascending Wide CPRs on NIFTY and BANKNIFTY signalling potential range-bound behaviour on 04 Aug, while SENSEX’s Ascending Narrow CPR hints at a possible trending session — divergence between Sensex (trending structure) and Nifty/BankNifty (wide, range-bound CPRs) creates a split-signal environment where confirmation above TC on each index is mandatory before committing to directional trades.
NIFTY 50
|
NIFTY 50
24,774.30
▲ +390.70 (+1.60%)
|
INDIA VIX
11.93
▲ +1.45%
Extreme Complacency
|
PCR
|
OI PCR
Week: 1.57
Month: 1.11
|
Vol PCR
Week: 1.00
Month: 1.11
|
|
ATM STRADDLE
Week185.75 pts
Month497.60 pts
|
|
OI SUPPORT (PE)
Week24,200
Month24,000
|
OI RESIST (CE)
Week25,000
Month25,000
|
CPR RELATIONSHIP
DayAscending — Wide
WeekAscending — Wide
MonthAscending — Wide
|
MAX PAIN
Week24,550
Month24,400
|
Week expiry: 04-Aug-2026 · Month expiry: 25-Aug-2026
BANK NIFTY
|
BANK NIFTY
58,247.95
▲ +983.10 (+1.72%)
|
INDIA VIX
11.93
▲ +1.45%
Extreme Complacency
|
PCR
|
OI PCR
Week: —
Month: 0.89
|
Vol PCR
Week: —
Month: 0.74
|
|
ATM STRADDLE
Month1,395.00 pts
|
|
OI SUPPORT (PE)
Month58,000
|
OI RESIST (CE)
Month59,000
|
CPR RELATIONSHIP
DayAscending — Wide
MonthAscending — Narrow
|
MAX PAIN
Month57,800
|
Month expiry: 25-Aug-2026
SENSEX
|
SENSEX
78,639.03
▲ +544.39 (+0.70%)
|
INDIA VIX
11.93
▲ +1.45%
Extreme Complacency
|
PCR
|
OI PCR
Week: 1.31
Month: 1.47
|
Vol PCR
Week: 0.90
Month: 1.10
|
|
ATM STRADDLE
Week667.50 pts
Month1,751.35 pts
|
|
OI SUPPORT (PE)
Week78,000
Month77,000
|
OI RESIST (CE)
Week79,000
Month80,000
|
CPR RELATIONSHIP
DayAscending — Narrow
WeekAscending — Wide
MonthAscending — Wide
|
MAX PAIN
Week78,500
Month78,200
|
Week expiry: 06-Aug-2026 · Month expiry: 27-Aug-2026
NIFTY
Ascending — Wide (0.35%)
▲ Bullish
|
Market Structure
Sideways or range-bound |
Straddle
ATM 24,750 — Weekly straddle = 185.75 pts (Call 13.6 + Put 172.15), implying a one-standard-deviation intraday move of approximately ±185 pts from 24,750, i.e. a range of roughly 24,564 to 24,936 for the expiry week; the heavily skewed Put premium (172.15 vs Call 13.6) reveals residual downside hedging despite yesterday’s rally, and traders should respect 24,564 as a straddle-derived soft floor. |
Max Pain
Max Pain for week expiry (04-Aug-2026) = 24,550 — price gravitating toward 24,550 into close benefits option sellers maximally; this level sits just below BC (24,644.72) and reinforces the idea that a drift back toward 24,550–24,600 is possible if bulls fail to hold CPR as support through the session. |
Tomorrow’s Complete Level Map
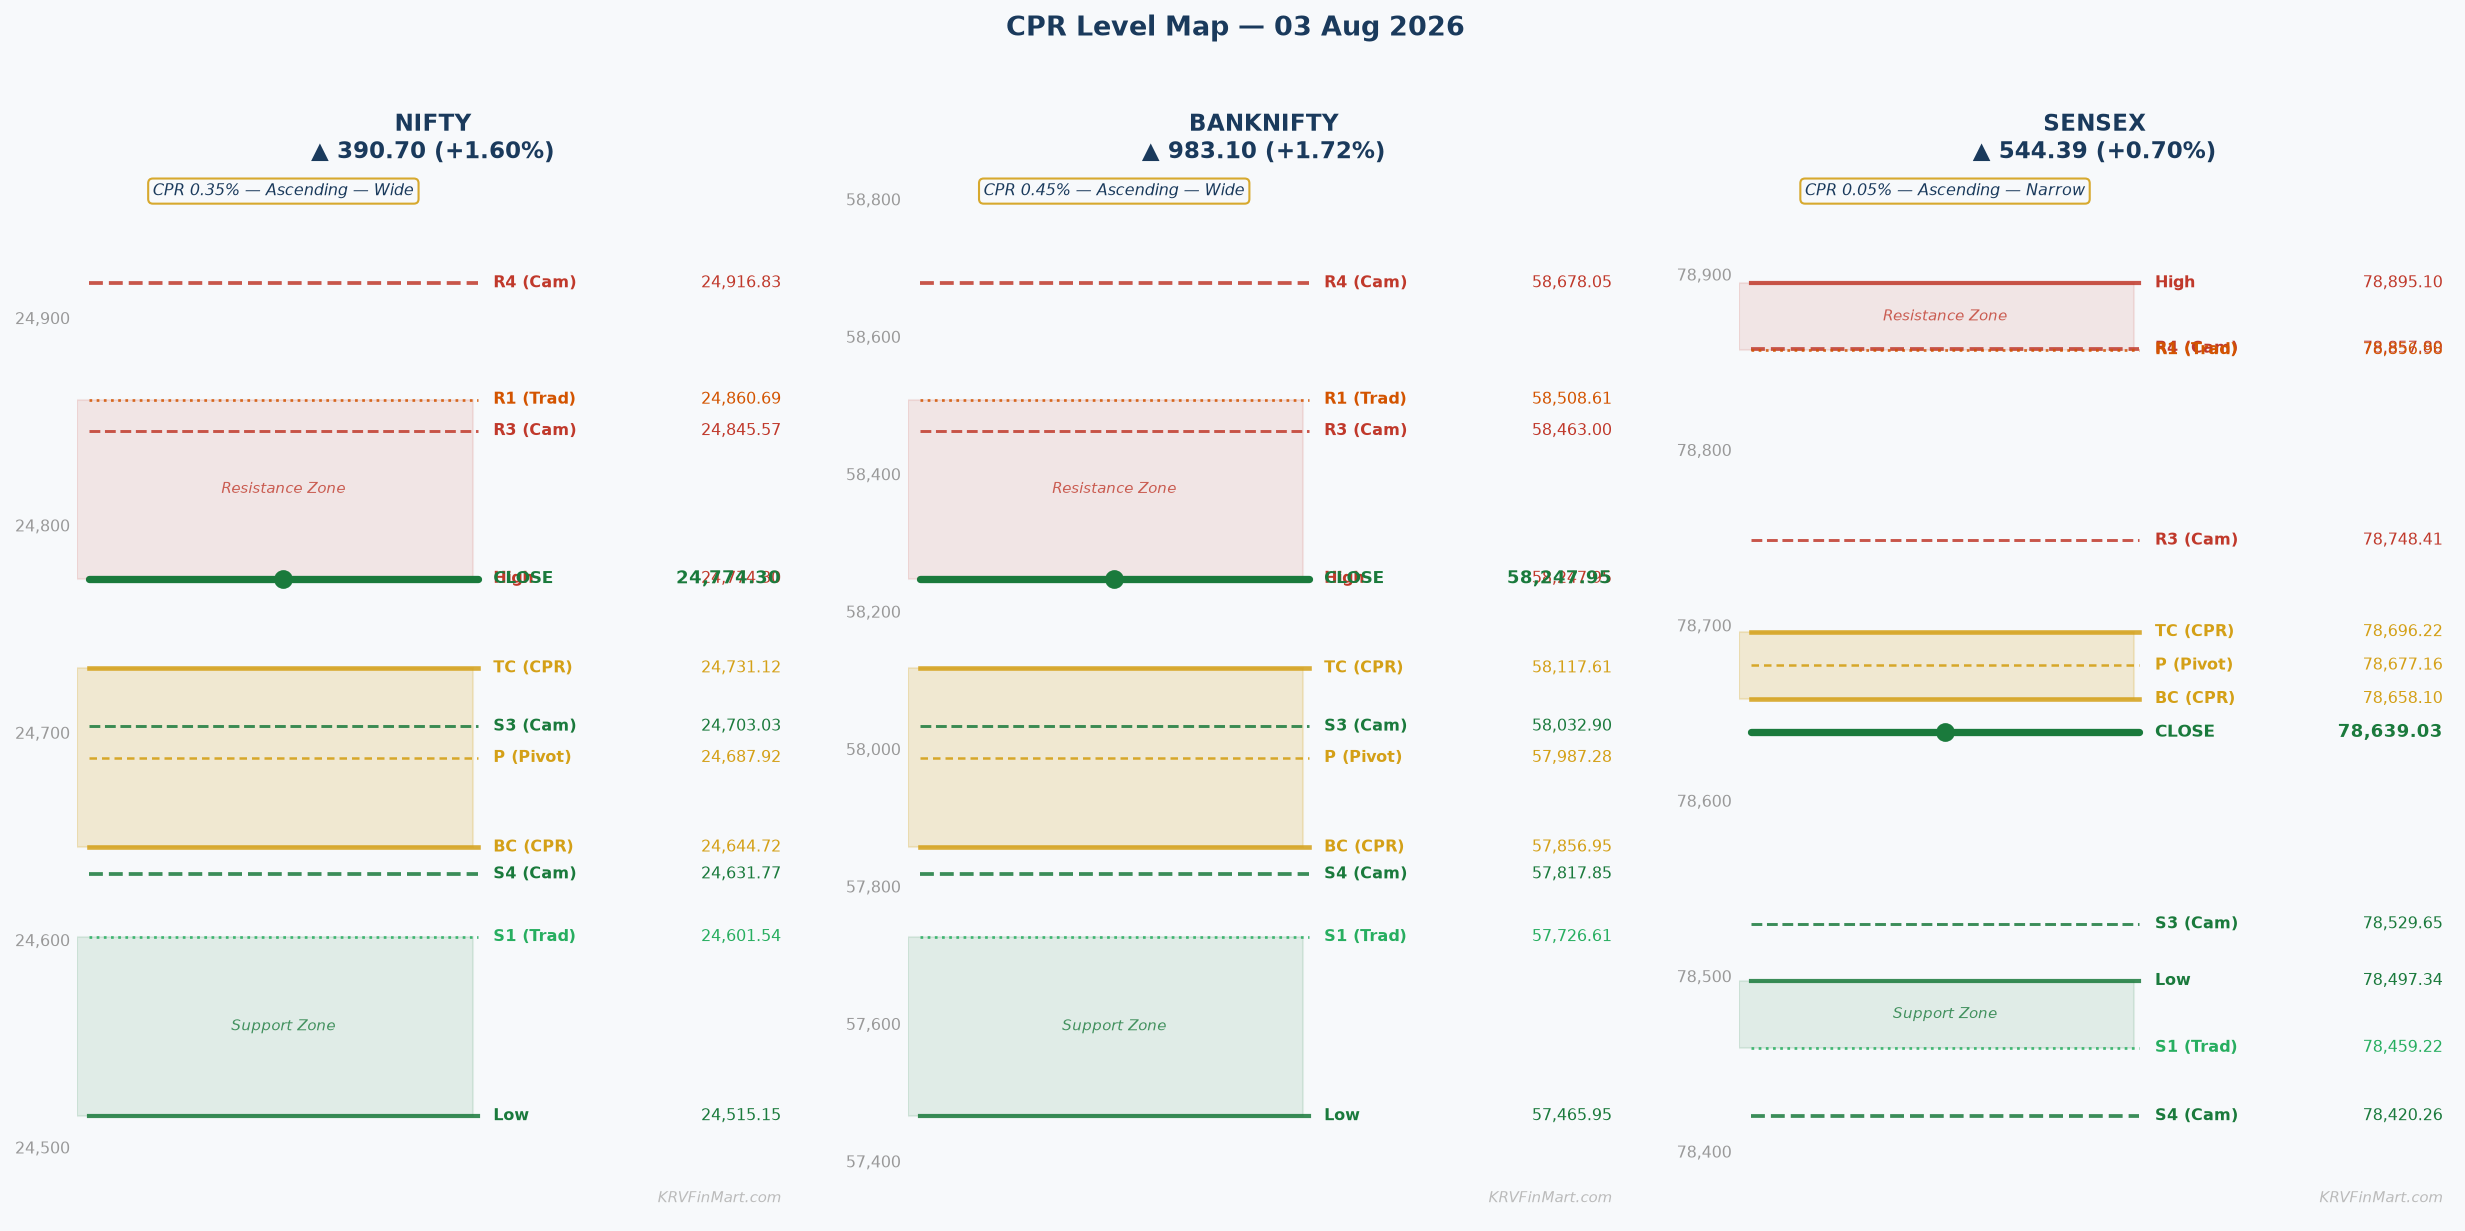
OI-R: 25,000 R3: 25,119.84 H6: 25,036.19 H5: 25,000.06 R2: 24,947.07 H4 ▶: 24,916.83 R1: 24,860.69 PDH: 24,774.30 H3 ↩: 24,845.57
TC: 24,731.12 P: 24,687.92 BC: 24,644.72
L3 ↩: 24,703.03 PDL: 24,515.15 S1: 24,601.54 L4 ▶: 24,631.77 S2: 24,428.77 L5: 24,548.54 L6: 24,512.41 S3: 24,342.39 OI-S: 24,200
↩ = Camarilla reversal point | ▶ = Camarilla breakout/breakdown trigger | OI-R/OI-S = Options wall (CE/PE max OI)
▲ Higher Open (Gap Up) — Open > Prev Close
▲ Bullish
Open lands: With an Ascending Wide CPR where BC=24,644.72 and TC=24,731.12 sit above yesterday’s close (24,774.30 is today’s PDH = prev close), a gap-up open on 04 Aug places price above TC (24,731.12) and potentially above or at the PDH (24,774.30), meaning the session begins with NIFTY already trading inside or above the entire CPR band — bulls have structural control from the opening bell.
CPR role: Launch pad and support zone — the entire CPR band (BC 24,644.72 to TC 24,731.12) acts as immediate intraday support, and any first pullback to TC (24,731.12) or Pivot (24,687.92) is a potential buy-the-dip opportunity for trend followers.
Minor Gap (0.05–0.25%) — Structure Dominant
A minor gap-up of 0.05–0.25% places NIFTY’s open between approximately 24,786 and 24,836, which is just above the PDH of 24,774.30 and below the Camarilla H3 at 24,845.57, confirming the Ascending CPR structure with a bullish lean but without overwhelming momentum. In this configuration, the Wide CPR (0.35%) acts as a strong support floor below the open, and the gap being minor means structure dominates — the CPR band from BC 24,644.72 to TC 24,731.12 is now well below price, firmly in support territory, making any intraday pullback to TC (24,731.12) a high-conviction buy zone. The immediate first target is Camarilla H3 at 24,845.57, followed by R1 at 24,860.69; per Wide CPR rules, two consecutive 30-minute closes above PDH (24,774.30) are required before adding size, and partial profits should be booked at H3/R1 before the next leg toward H4 (24,916.83).
Significant Gap (0.25–0.5%) — Balanced
A significant gap-up of 0.25–0.50% opens NIFTY between roughly 24,836 and 24,898, placing price above H3 (24,845.57) and in the zone between R1 (24,860.69) and H4 (24,916.83) — this is an opening directly into first-level resistance, where CE writers at the OI wall of 25,000 will start to defend aggressively. Gap-fill risk is real and elevated in this zone: with price opening above H3 (24,845.57), the market may see initial selling pressure as longs from 03 Aug book profits near this Camarilla mean-reversion level, and delta-hedging flows from CE sellers will amplify the resistance. If NIFTY sustains two 30-minute closes above H3 (24,845.57), the path opens to H4 (24,916.83) and then R2 (24,947.07); however, failure at H3 triggers a fade trade targeting a return to the CPR pivot at 24,687.92 or TC at 24,731.12.
Large Gap (>0.5%) — Gap Direction Dominant
A large gap-up of more than 0.50% opens NIFTY above approximately 24,898, which places price in the H4–H5 zone (24,916.83 to 25,000.06) and dangerously close to or at the primary OI resistance wall at 25,000 — this is a direct opening into the CE max OI strike where maximum gamma resistance resides. With NIFTY opening near the 25,000 OI wall, the probability of a gap-fill becomes significant (60–70%) as CE writers defend aggressively and longs from previous sessions monetise; the weekly straddle of just 185.75 points further confirms that the market has not priced a sustained breakout above 25,000, so a gap-up to this zone is more likely a fade opportunity than a momentum chase. The abort level for any gap-up long is a two 30-minute close below H3 (24,845.57); if NIFTY holds above 25,000.06 (H5) with volume, the next extension target is H6 at 25,036.19 and then R3 at 25,119.84, but this requires exceptional breadth confirmation.
|
▲ Upside Path → OI-R
From a gap-up open, the upside sequence is H3 (24,845.57) → R1 (24,860.69) → H4 (24,916.83) → R2 (24,947.07) → H5/OI-R (25,000.06/25,000) — each of these levels acts as a natural partial-profit zone, and genuine momentum is confirmed when NIFTY closes a 30-minute candle above H4 (24,916.83) with expanding volume, signalling that the CE wall at 25,000 is being tested rather than faded. The OI resistance at 25,000 is the session ceiling under normal conditions; a sustained print above H5 (25,000.06) backed by fresh long buildup in futures would be required to open the R3 target at 25,119.84. |
▼ Downside Path → OI-S
If the gap-up fails and NIFTY slips back below TC (24,731.12), the failure path runs TC (24,731.12) → P (24,687.92) → BC (24,644.72) → L4 (24,631.77) → S1 (24,601.54) — losing TC converts the CPR band from a launch pad into an overhead resistance zone, making recovery significantly harder. A breach below BC (24,644.72) with a confirmed 30-minute close flips the day bearish and targets L5 (24,548.54), then the max pain level at 24,550 and OI support at 24,200 on further deterioration. |
|
🔴 OI-R: The OI resistance at **25,000** (CE max OI strike) is the primary session ceiling for any gap-up scenario — CE writers have positioned the heaviest supply at this strike, meaning every rally toward 25,000 encounters aggressive call writing that creates a gamma wall, capping upside and generating mean-reversion pressure. This dynamic means that even if NIFTY gaps up aggressively, approaching 25,000 without a significant options unwinding event (visible in real-time OI data) is a high-risk long zone and a preferred short-initiation area for disciplined traders. |
🟢 OI-S: The OI support at **24,200** (PE max OI strike) is distant from a gap-up open scenario and therefore irrelevant as an immediate downside target — however, it serves as the ultimate structural floor where PUT writers have built maximum support, and a test of this level would require a complete breakdown of multiple CPR and Camarilla supports. In a gap-up context, 24,200 remains the abort level for any multi-day long positions; intraday traders should focus on BC (24,644.72) and S1 (24,601.54) as the more actionable downside references. |
⚡ Key Trigger: The key directional trigger for a gap-up open is a **two consecutive 30-minute candle close above PDH 24,774.30 and TC 24,731.12** — both must be respected as the new intraday support floor, as this confirms that the gap was absorbed by buyers rather than being a trap; if NIFTY fails to sustain above TC (24,731.12) on any 30-minute close, the session’s bullish structure collapses and a reversal toward P (24,687.92) and BC (24,644.72) becomes the dominant scenario. On the bullish side, closing two back-to-back 30-minute candles above H3 (24,845.57) with above-average volume is the trigger to add to longs targeting H4 (24,916.83) and the OI wall at 25,000, while a single 30-minute close below TC invalidates the gap-up premise entirely.
▼ Lower Open (Gap Down) — Open < Prev Close
▼ Bearish
Open lands: For an Ascending CPR where BC=24,644.72, a gap-down open on 04 Aug places NIFTY below the entire CPR band — the session opens below BC (24,644.72) and potentially below P (24,687.92) and TC (24,731.12), meaning the entire ascending CPR structure becomes overhead resistance rather than support, completely reversing the bullish bias built from yesterday’s close.
CPR role: Overhead resistance and battleground — the CPR band (BC 24,644.72 to TC 24,731.12) transforms into a resistance ceiling in a gap-down scenario; bulls must fight through the entire band to recover, while bears use any failed reclaim of BC as confirmation to add shorts.
Minor Gap (0.05–0.25%) — Structure Dominant
A minor gap-down of 0.05–0.25% places NIFTY’s open between approximately 24,712 and 24,762, which is between BC (24,644.72) and TC (24,731.12) — a minor gap-down actually opens inside the CPR band, making this a high-information ambiguous scenario rather than a clear directional one. Minor gaps inside the CPR band (especially on Wide CPR days) tend to fill within 30–60 minutes as the market resolves direction, with BC (24,644.72) serving as the bear confirmation level — a 30-minute close below BC is the signal that sellers have control and L3 (24,703.03) is actually above the open in this case, meaning the first Camarilla target on the downside would be L4 (24,631.77) and then S1 (24,601.54). Traders should wait for the first 30-minute candle to close; above TC (24,731.12) triggers a gap-fill long targeting PDH (24,774.30) and H3 (24,845.57), while below BC (24,644.72) confirms bearish resumption toward L4 (24,631.77), S1 (24,601.54), and then L5 (24,548.54).
Significant Gap (0.25–0.5%) — Balanced
A significant gap-down of 0.25–0.50% opens NIFTY between approximately 24,650 and 24,712, placing the open at or just below BC (24,644.72) — this is a critical threshold where the ascending CPR is directly threatened and bears have the early structural advantage. In this scenario, the failure-and-resume pattern dominates: if NIFTY cannot reclaim BC (24,644.72) within the first two 30-minute bars, PUT writers gain confidence and fresh short positions are initiated, targeting L4 (24,631.77), S1 (24,601.54), and then L5 (24,548.54); however, if bulls reclaim BC quickly with volume, the gap-fill recovery toward P (24,687.92) and TC (24,731.12) becomes the dominant trade. The PUT writing community at OI support 24,200 will begin defending if NIFTY approaches L5 (24,548.54) and L6 (24,512.41), potentially creating a sharp intraday bounce from those levels.
Large Gap (>0.5%) — Gap Direction Dominant
A large gap-down of more than 0.50% opens NIFTY below approximately 24,650, potentially in the S1 (24,601.54) to L4 (24,631.77) zone or even lower, triggering panic selling from overnight longs who were positioned after yesterday’s +1.60% rally. The panic-vs-recovery dynamic is critical here: the weekly straddle of 185.75 points implies that a move of this magnitude (100+ points gap-down on top of 185.75 straddle) represents a 1–2 standard deviation event, meaning PUT holders gain significant premium and may sell-to-close near L5 (24,548.54) or L6 (24,512.41), creating sharp intraday bounces. The abort for recovery longs is a sustained 30-minute close below L6 (24,512.41) and PDL (24,515.15); if both break, the next target is S2 (24,428.77) and ultimately the OI support at 24,200 where PE max OI sits.
|
▲ Upside Path → OI-R
The recovery path for a gap-down scenario runs BC (24,644.72) → P (24,687.92) → TC (24,731.12) → PDH (24,774.30) → H3 (24,845.57) — genuine recovery is confirmed only when NIFTY closes a 30-minute candle above TC (24,731.12) with above-average volume, distinguishing a real bull reclaim from a dead-cat bounce that stalls at the Pivot (24,687.92). The OI resistance at 25,000 remains the session ceiling even in a recovery scenario, and traders should book partial profits at H3 (24,845.57) and R1 (24,860.69) if the recovery extends. |
▼ Downside Path → OI-S
The bearish continuation path runs L3 (24,703.03) → L4 (24,631.77) → S1 (24,601.54) → L5 (24,548.54) → L6 (24,512.41) → OI-S (24,200) — retail stop-losses concentrated below L3 and L4 accelerate the downside move as their activation triggers cascading sell orders, and this mechanical stop-running is particularly sharp in expiry-week sessions where delta hedging amplifies intraday swings. The max pain level at 24,550 (sitting between L5 at 24,548.54 and L4 at 24,631.77) acts as a gravity point in the afternoon session; if NIFTY is trading near 24,550 by 2 PM, expect choppy, low-conviction price action as option sellers defend the zone. |
|
🔴 OI-R: The OI resistance at **25,000** is significantly elevated above a gap-down open scenario and functions as an overhead ceiling that shorts can use as a distant reference — CE writers at 25,000 have no immediate gamma pressure in a gap-down, meaning they passively defend and do not need to delta-hedge aggressively, which removes a key source of upside buying pressure. In this scenario, 25,000 is irrelevant for intraday long trades and serves primarily as a reminder that the market’s option architecture remains bearish above the current trading level. |
🟢 OI-S: The OI support at **24,200** (PE max OI) is the primary downside target and PUT monetisation zone — as NIFTY approaches 24,200, PE holders with maximum open interest will begin closing positions (buying back puts) as they near maximum profit, creating a natural bounce zone. However, if NIFTY breaches 24,200 with conviction and volume, the support becomes a breakdown level that triggers further PUT writing at lower strikes, implying an accelerated move toward S3 (24,342.39) and lower monthly levels. |
⚡ Key Trigger: **Failure to reclaim BC (24,644.72) within two 30-minute candles confirms bearish resumption** — this is the structural fulcrum because the ascending CPR places the entire band above the gap-down open, and BC acts as the dividing line between a temporary sell-off and a full-day bearish session. On the bull recovery side, a confirmed 30-minute close above BC (24,644.72) followed by a hold above P (24,687.92) triggers a long toward TC (24,731.12) and then the PDH (24,774.30); on the bear confirmation side, every failed recovery at BC gives sellers a new short-entry with a stop above TC (24,731.12).
◆ Near Flat Open — Open ≈ Prev Close (±0.05%)
◆ Neutral
Open lands: A ±0.05% flat open places NIFTY between approximately 24,762 and 24,786 — this is above TC (24,731.12) and near PDH (24,774.30), meaning a flat open actually positions NIFTY above the entire Ascending CPR band, making the entire CPR band (BC 24,644.72 to TC 24,731.12) an immediate support zone below the open.
CPR role: Support zone and decision base — with a flat open above TC (24,731.12), the CPR band acts as a support floor; the key battle is whether NIFTY can sustain above PDH (24,774.30) and push toward H3 (24,845.57), or whether it pulls back into the CPR band and then below BC (24,644.72) as a failed breakout.
Near Flat (±0.05%)
A flat open near prev close (24,774.30) on an Ascending Wide CPR day is a high-information setup because price opens above the entire CPR band (BC 24,644.72 to TC 24,731.12), creating a unique dynamic where the CPR acts as a lower boundary and PDH (24,774.30) acts as the immediate resistance — the first 15-minute candle IS the trade signal, revealing whether institutional participants who bought the 03 Aug rally are adding at the open or distributing. The Wide CPR (0.35%) introduces range-bound caution: per Wide CPR rules, two consecutive 30-minute closes above PDH (24,774.30) are needed before committing to longs, and traders should be prepared for early choppiness between TC (24,731.12) and H3 (24,845.57) as the market digests the previous session’s gains. If CPR was narrower (below 0.15%), the probability of a trend day would be very high; but at 0.35% width, the Wide CPR creates a range-bound bias where fading moves at extremes (H3 on the upside, BC on the downside) is more reliable than chasing breakouts — the max pain level at 24,550 further anchors expectations that a drift back toward the CPR interior is possible by afternoon. The bull trigger is a **two 30-minute close above PDH (24,774.30) and H3 (24,845.57)** targeting R1 (24,860.69), H4 (24,916.83), and the OI wall at 25,000; the bear trigger is a **30-minute close below TC (24,731.12)** followed by a break of P (24,687.92) targeting BC (24,644.72), L4 (24,631.77), and S1 (24,601.54) — both triggers require volume confirmation to distinguish genuine directional momentum from noise.
|
▲ Upside Path → OI-R
TC (24,731.12) → PDH (24,774.30) → H3 (24,845.57) → R1 (24,860.69) → H4 (24,916.83) → OI-R (25,000) — genuine upside momentum is confirmed when NIFTY closes two 30-minute candles above H3 (24,845.57) with volume, as H3 is the Camarilla mean-reversion reference and sustained trading above it signals that the day has shifted from range to trend mode. Per Wide CPR rules, partial profits must be taken at R1 (24,860.69) and the position should not be trailed beyond OI-R (25,000), as CE writers will aggressively defend that level. |
▼ Downside Path → OI-S
TC (24,731.12) → P (24,687.92) → BC (24,644.72) → L4 (24,631.77) → S1 (24,601.54) → L5 (24,548.54) → OI-S (24,200) — once TC (24,731.12) is breached on a 30-minute close, the CPR band converts from support to resistance, and the next natural resting zone is BC (24,644.72) followed by L4 (24,631.77); retail stop-losses clustered below BC and L4 will accelerate the move to S1 (24,601.54) and the max pain zone of 24,550. A full move to OI-S (24,200) from a flat open requires a significantly bearish catalyst and would represent a ~2.3% intraday decline, which is beyond the weekly straddle’s 185.75-point implied range. |
|
🔴 OI-R: The OI resistance at **25,000** (CE max OI) acts as the ceiling CE writers have built for this expiry week — in a flat-open scenario, 25,000 is approximately 226 points above the open, making it an ambitious target for a single session, but it is the level where call writing is heaviest and where any bullish momentum will face the strongest gamma headwind. Traders running long trades from a flat-open breakout should exit or hedge aggressively as NIFTY approaches 25,000, as CE writer delta-hedging at this strike creates artificial supply that caps gains unless there is a significant OI unwinding event. |
🟢 OI-S: The OI support at **24,200** (PE max OI) is the primary structural floor where PUT writers have built maximum exposure — in a flat-open scenario, this level is approximately 574 points below the open and serves as the expiry week’s ultimate downside anchor, where PE holders will aggressively defend. For intraday purposes, 24,200 is not an actionable target from a flat open unless an extreme breakdown materialises; it primarily serves as the level below which the market’s weekly option structure would be completely invalidated, signalling a paradigm shift in sentiment. |
⚡ Key Trigger: **Two consecutive 30-minute candle closes above PDH 24,774.30 = bull trigger targeting H3 (24,845.57) and R1 (24,860.69); a single 30-minute close below TC (24,731.12) = bear trigger targeting P (24,687.92) and BC (24,644.72)** — PDH/TC is the structural fulcrum because it separates the zone where bulls from yesterday’s session remain in control (above 24,774.30) from the zone where profit-booking and new shorts begin to dominate (below TC 24,731.12). The Wide CPR rule demands two closes rather than one for bull confirmation, as false breakouts above PDH on Wide CPR days are statistically more common than on Narrow CPR days, making patience and confirmation the edge for 04 Aug.
BANKNIFTY
Ascending — Wide (0.45%)
▲ Bullish
|
Market Structure
Sideways or range-bound |
Straddle
ATM 58,200 — Monthly straddle = 1,395.0 pts (Call 534.45 + Put 860.55), implying a one-standard-deviation move of approximately ±1,395 pts from 58,200, giving a monthly range of roughly 56,805 to 59,595; the elevated Put premium (860.55 vs Call 534.45) confirms that traders are paying more for downside protection even after BANKNIFTY’s +1.72% rally, and the 1,395-point implied range means intraday swings of 300–500 points are fully within expected volatility. |
Max Pain
Max Pain for month expiry (25-Aug-2026) = 57,800 — this sits just below BC (57,856.95) and above S1 (57,726.61), suggesting that option sellers benefit most from BANKNIFTY gravitating toward the 57,800–57,900 zone by expiry; for 04 Aug intraday purposes, this means the BC zone acts as a magnet, and any session that fails to sustain above TC (58,117.61) may drift back toward 57,800. |
Tomorrow’s Complete Level Map
OI-R: 59,000 R3: 59,290.61 H6: 59,040.59 H5: 58,929.23 R2: 58,769.28 H4 ▶: 58,678.05 R1: 58,508.61 PDH: 58,247.95 H3 ↩: 58,463
TC: 58,117.61 P: 57,987.28 BC: 57,856.95
L3 ↩: 58,032.90 PDL: 57,465.95 S1: 57,726.61 L4 ▶: 57,817.85 S2: 57,205.28 L5: 57,566.67 L6: 57,455.31 S3: 56,944.61 OI-S: 58,000
↩ = Camarilla reversal point | ▶ = Camarilla breakout/breakdown trigger | OI-R/OI-S = Options wall (CE/PE max OI)
▲ Higher Open (Gap Up) — Open > Prev Close
▲ Bullish
Open lands: With BANKNIFTY’s Ascending Wide CPR (BC=57,856.95, TC=58,117.61) sitting below the prev close of 58,247.95 (which is PDH), a gap-up open on 04 Aug places price above TC (58,117.61) and above PDH (58,247.95) — meaning the open is above the entire CPR band and in the zone between PDH (58,247.95) and H3 (58,463), where the first Camarilla resistance resides.
CPR role: Launch pad and support zone — the CPR band (BC 57,856.95 to TC 58,117.61) becomes a strong intraday support zone approximately 130–390 points below the gap-up open, providing a cushion for intraday long positions while serving as the level to watch for any bull-trap reversal.
Minor Gap (0.05–0.25%) — Structure Dominant
A minor gap-up of 0.05–0.25% places BANKNIFTY’s open between approximately 58,277 and 58,394, in the zone between PDH (58,247.95) and H3 (58,463) — this is an ideal gap-up configuration for the Ascending Wide CPR, as price opens with the entire CPR band as support and the first resistance at H3 (58,463) within reach. The Wide CPR (0.45%) structure dominant over the minor gap means that two consecutive 30-minute closes are required to confirm the bullish direction, and traders should wait for BANKNIFTY to sustain above PDH (58,247.95) before adding; premature longs at the open risk being caught in an early fade toward TC (58,117.61). First upside target is H3 (58,463), with partial profits there; if H3 holds with two 30-minute closes above it, the next target is R1 (58,508.61) and then H4 (58,678.05) — per Wide CPR rules, do not trail beyond OI-R (59,000).
Significant Gap (0.25–0.5%) — Balanced
A significant gap-up of 0.25–0.50% opens BANKNIFTY between approximately 58,393 and 58,539, placing the index directly at or above H3 (58,463) and at R1 (58,508.61) — this is an opening into first-level Camarilla resistance, where mean-reversion sellers typically initiate short positions for fade trades. Gap-fill risk is significant in this configuration: CE writers at OI resistance 59,000 will begin delta-hedging as BANKNIFTY approaches H4 (58,678.05), and the elevated straddle (1,395 pts) suggests the session could see early volatility before a directional move is established. Two 30-minute closes above H3 (58,463) are mandatory before adding longs targeting H4 (58,678.05), R2 (58,769.28), and then H5 (58,929.23); a failure at H3 with a close below it triggers a fade to PDH (58,247.95), TC (58,117.61), and eventually the CPR midpoint at P (57,987.28).
Large Gap (>0.5%) — Gap Direction Dominant
A large gap-up of more than 0.50% opens BANKNIFTY above approximately 58,539, potentially in the H4–H5 zone (58,678.05 to 58,929.23) or approaching H6 (59,040.59) and the OI resistance at 59,000 — an opening this close to the primary CE max OI wall is a high-risk long entry and a preferred fade zone for experienced traders. With the monthly straddle at 1,395 points from ATM 58,200, a large gap-up opening 400–700 points above the previous close represents a move that is outside the typical single-session expected range, making gap-fill probability very high (65–75%). The abort level for recovery bears is a sustained two 30-minute close above H6 (59,040.59) and OI-R (59,000); if BANKNIFTY breaches these, the R3 target at 59,290.61 opens but this is an exceptional scenario requiring major catalyst news.
|
▲ Upside Path → OI-R
PDH (58,247.95) → H3 (58,463) → R1 (58,508.61) → H4 (58,678.05) → R2 (58,769.28) → H5 (58,929.23) → H6 (59,040.59) → OI-R (59,000) — genuine upside momentum in BANKNIFTY is confirmed by sustained Volume above the 20-day average combined with sustained price above H3 (58,463) on multiple 30-minute closes; partial profits must be booked at R1 (58,508.61) and again at H4 (58,678.05) per Wide CPR profit-taking rules. The OI resistance at 59,000 is the absolute intraday ceiling for this session, and traders should not hold net long exposure above H5 (58,929.23) without evidence of CE OI unwinding. |
▼ Downside Path → OI-S
Failure path: TC (58,117.61) → P (57,987.28) → BC (57,856.95) → L4 (57,817.85) → S1 (57,726.61) → L5 (57,566.67) → OI-S (58,000) — a break below TC in a gap-up session is a significant red flag that signals institutional distribution at the open, and the descent toward P (57,987.28) and BC (57,856.95) will be accelerated by stop-losses from retail longs who bought the gap. Note that OI-S at 58,000 sits between BC (57,856.95) and TC (58,117.61), creating a compressed battleground zone where PUT writers defend aggressively; a break below OI-S (58,000) confirms a failed gap-up and opens the L4 (57,817.85) and S1 (57,726.61) targets. |
|
🔴 OI-R: The OI resistance at **59,000** (CE max OI) is the dominant session ceiling — CE writers have built the heaviest supply at this strike for the monthly expiry, and as BANKNIFTY approaches 59,000, aggressive call writing resumes, creating a gamma wall that suppresses price. In a gap-up scenario, 59,000 is approximately 750 points above PDH (58,247.95), making it achievable only in exceptional circumstances; traders should treat any approach to H5 (58,929.23) or H6 (59,040.59) as a proximity warning to reduce long exposure significantly. |
🟢 OI-S: The OI support at **58,000** (PE max OI) is unusually close to the current price level — sitting between BC (57,856.95) and TC (58,117.61), the 58,000 strike represents the most critical intraday support level, where PUT writers will defend aggressively on any pullback. In a gap-up scenario, 58,000 serves as the floor-within-the-CPR, meaning a gap-up that subsequently drops below 58,000 is an extremely bearish signal indicating that both the CPR support and the OI support have failed, opening the path to L4 (57,817.85) and S1 (57,726.61). |
⚡ Key Trigger: **Two consecutive 30-minute candle closes above PDH (58,247.95) and TC (58,117.61) confirm bullish structure** — PDH is the critical level because it was yesterday’s intraday high and represents the maximum price at which buyers are currently comfortable; sustained trading above PDH signals incremental demand rather than short-covering. On the upside, two 30-minute closes above H3 (58,463) is the high-conviction long trigger targeting H4 (58,678.05); on the downside, a single 30-minute close below TC (58,117.61) cancels the gap-up thesis and initiates the bearish reversal sequence toward P (57,987.28), BC (57,856.95), and OI-S (58,000).
▼ Lower Open (Gap Down) — Open < Prev Close
▼ Bearish
Open lands: A gap-down on an Ascending Wide CPR (BC=57,856.95, TC=58,117.61) places BANKNIFTY’s open below the entire CPR band — price opens below BC (57,856.95) and potentially at or below the critical OI support level of 58,000, which sits between BC and TC; this creates an immediate convergence of CPR-below-open structure and OI-S violation risk, making this the most bearish opening scenario.
CPR role: Overhead resistance and trap zone — the entire CPR band (BC 57,856.95 to TC 58,117.61) becomes resistance above the open; the particularly dangerous aspect is that OI-S (58,000) sits inside the CPR band, meaning a gap-down simultaneously breaches both the CPR floor and the key PUT support strike.
Minor Gap (0.05–0.25%) — Structure Dominant
A minor gap-down of 0.05–0.25% opens BANKNIFTY between approximately 57,978 and 58,219, which places the index below TC (58,117.61) and potentially below P (57,987.28) but above BC (57,856.95) — this minor gap actually lands inside the CPR band, creating a scenario where the CPR is both above and below the open. In this inside-CPR-band minor gap scenario, the key watch is whether BANKNIFTY can reclaim TC (58,117.61) within the first 30 minutes to resume bullishness, or whether it breaks below BC (57,856.95) and OI-S (58,000) to confirm bearish continuation. A 30-minute close above TC (58,117.61) triggers a long targeting PDH (58,247.95) and H3 (58,463); a 30-minute close below BC (57,856.95) confirms bearish structure targeting L4 (57,817.85), S1 (57,726.61), and L5 (57,566.67).
Significant Gap (0.25–0.5%) — Balanced
A significant gap-down of 0.25–0.50% opens BANKNIFTY between approximately 57,830 and 57,978, placing the index at or slightly below BC (57,856.95) and clearly violating the OI support at 58,000 — this is a structurally bearish opening that challenges the PUT writers’ defense line immediately. The failure-and-resume pattern is primary: if BANKNIFTY cannot reclaim OI-S (58,000) and BC (57,856.95) within two 30-minute bars, PUT writers at 58,000 begin cutting positions (buying back PUTs) and fresh short positions are initiated targeting L4 (57,817.85), S1 (57,726.61), and the max pain area near 57,800. Recovery through BC (57,856.95) and P (57,987.28) back above OI-S (58,000) within 30 minutes converts the gap-down into a whipsaw bull trap; traders should watch the 58,000 level as the single most important reference in this scenario.
Large Gap (>0.5%) — Gap Direction Dominant
A large gap-down of more than 0.50% opens BANKNIFTY below approximately 57,830, potentially in the L4 (57,817.85) to S1 (57,726.61) zone, which would constitute a simultaneous breach of BC (57,856.95), OI-S (58,000), L4 (57,817.85), and the max pain level of 57,800 — a cascade of critical support failures at the opening bell. The monthly straddle of 1,395 points from ATM 58,200 provides context: a large gap-down of 500+ points represents a significant portion of the monthly expected range, suggesting PUT holders will aggressively monetise near L5 (57,566.67) and L6 (57,455.31), creating potential sharp intraday bounces from these zones. The recovery abort level is a sustained close above BC (57,856.95) and OI-S (58,000); if both recover with volume, straddle sellers who shorted the volatility will buy back PUTs causing a sharp bounce; if they fail, the path to S2 (57,205.28) opens.
|
▲ Upside Path → OI-R
Recovery path: BC (57,856.95) → OI-S (58,000) → P (57,987.28) → TC (58,117.61) → PDH (58,247.95) → H3 (58,463) — the recovery sequence requires BANKNIFTY to clear both BC and OI-S in rapid succession; partial longs can be initiated at BC with a stop below L4 (57,817.85), but full commitment to longs requires a sustained close above TC (58,117.61). Genuine recovery (not a dead-cat bounce) is confirmed by closing volume above the 20-period average and BANKNIFTY holding TC (58,117.61) on retest. |
▼ Downside Path → OI-S
Bearish continuation: L3 (58,032.90) → BC (57,856.95) → L4 (57,817.85) → S1 (57,726.61) → L5 (57,566.67) → L6 (57,455.31) → OI-S (58,000 — then next support S2 57,205.28) — once BC (57,856.95) and OI-S (58,000) fail as support, retail stop-losses below L4 (57,817.85) and S1 (57,726.61) trigger a mechanical waterfall selling sequence, with the next meaningful support at L5 (57,566.67) and L6 (57,455.31) near the PDL (57,465.95). The PDL at 57,465.95 and L6 at 57,455.31 form a tight double-support cluster that will provide a strong intraday bounce even in a bearish session; traders should book short profits and reduce size near this zone. |
|
🔴 OI-R: The OI resistance at **59,000** (CE max OI) is far above in a gap-down scenario and is functionally irrelevant for intraday direction — CE writers are comfortable as the market moves away from their strike, and they do not need to delta-hedge, which removes a source of intraday buying. For gap-down bears, 59,000 confirms that the options market is not pricing any recovery to that level, reinforcing the bearish directional bias. |
🟢 OI-S: The OI support at **58,000** (PE max OI) is the single most critical level in a BANKNIFTY gap-down scenario — it sits precisely inside the CPR band between BC (57,856.95) and TC (58,117.61), making it the first real battleground where PUT writers defend and bears probe simultaneously. A decisive break below 58,000 with a sustained 30-minute close triggers PUT writer capitulation (buying back puts), which paradoxically accelerates downside selling pressure as their hedging unwinds; conversely, a recovery above 58,000 from below triggers a sharp short-covering rally that can extend 200–300 points rapidly. |
⚡ Key Trigger: **Failure to reclaim BC (57,856.95) and OI-S (58,000) within two 30-minute candles confirms full bearish session** — these two levels are practically confluent and represent the combined structural floor of the CPR base and the PUT max OI strike, making their joint failure the single most bearish signal of the session. Bull recovery trigger: a clean 30-minute close above OI-S (58,000) followed by a close above P (57,987.28) is the minimum required for longs, while a close above TC (58,117.61) is the high-conviction recovery signal targeting PDH (58,247.95).
◆ Near Flat Open — Open ≈ Prev Close (±0.05%)
◆ Neutral
Open lands: A ±0.05% flat open places BANKNIFTY between approximately 58,219 and 58,277 — this is above TC (58,117.61) and above PDH (58,247.95), meaning a flat open positions BANKNIFTY above the entire Ascending CPR band, with the CPR acting as a support cushion approximately 130–390 points below the open.
CPR role: Support base and decision zone — with a flat open above TC (58,117.61), the CPR band becomes a reference support approximately 100–400 points below; the primary battle on a flat open is whether BANKNIFTY can push above PDH (58,247.95) to trigger H3 (58,463) longs, or whether it drifts back into the CPR band and below OI-S (58,000) for a bearish intraday structure.
Near Flat (±0.05%)
A flat open near prev close (58,247.95) on an Ascending Wide CPR day places BANKNIFTY above the entire CPR band, which is a nuanced setup — the CPR is firmly below price as support, but the Wide CPR (0.45%) means range-bound behaviour is more likely than a clean trend day, requiring patience and confirmation before directional commitments. The critical levels for a flat-open session are TC (58,117.61) as the bull/bear dividing line below, OI-S (58,000) as the secondary support, and PDH (58,247.95) as the immediate resistance above; a flat open that holds above PDH suggests bulls absorbed yesterday’s sellers at the open and are ready for continuation, while a drift below TC (58,117.61) into the CPR band signals distribution. With Wide CPR rules mandating two 30-minute closes for confirmation, the first 60 minutes of the session are primarily information-gathering: traders should watch whether volume is above average (bullish) or below average (neutral/distribution) as BANKNIFTY oscillates between TC (58,117.61) and H3 (58,463). The dual triggers are: **bull — two 30-minute closes above PDH (58,247.95) with volume targeting H3 (58,463) and R1 (58,508.61)**, and **bear — single 30-minute close below TC (58,117.61) followed by a break of OI-S (58,000) targeting BC (57,856.95), L4 (57,817.85), and S1 (57,726.61)** — the bear trigger is particularly powerful because it simultaneously violates the CPR support and the OI support, creating cascading downside pressure.
|
▲ Upside Path → OI-R
PDH (58,247.95) → H3 (58,463) → R1 (58,508.61) → H4 (58,678.05) → R2 (58,769.28) → H5 (58,929.23) → OI-R (59,000) — the upside path for a flat-open BANKNIFTY session follows the Camarilla and Traditional levels in sequence, with H3 (58,463) being the first meaningful resistance and R1 (58,508.61) the first partial-profit target per Wide CPR rules. A sustained move above H4 (58,678.05) with volume opens the path to the OI wall at 59,000, but traders must reduce position size significantly as price approaches 59,000 due to the CE writing pressure at that strike. |
▼ Downside Path → OI-S
TC (58,117.61) → OI-S (58,000) → BC (57,856.95) → L4 (57,817.85) → S1 (57,726.61) → L5 (57,566.67) → L6 (57,455.31) — the downside path from a flat open requires cascading failures of TC, OI-S, and BC in sequence; the L4 (57,817.85) and max pain (57,800) confluence is a natural partial-cover zone for shorts, and the PDL (57,465.95)/L6 (57,455.31) cluster is the extreme intraday downside. Retail stops below OI-S (58,000) and BC (57,856.95) will fuel mechanical selling acceleration between these levels. |
|
🔴 OI-R: The OI resistance at **59,000** (CE max OI) is approximately 753 points above a flat open near 58,247 — it is the monthly expiry ceiling where CE writers are most concentrated, and any approach to 59,000 within a single session from a flat open would require exceptional bullish momentum beyond the Wide CPR’s range-bound expectation. For flat-open traders, 59,000 is the maximum upside target for scalp longs; CE writers will aggressively defend and exit-long signals should be placed at H5 (58,929.23) and H6 (59,040.59) in anticipation of the OI wall friction. |
🟢 OI-S: The OI support at **58,000** (PE max OI) is just 248 points below a flat open near 58,247.95 and is exceptionally close and actionable — PUT writers at this strike will buy aggressively on any test of 58,000, making it the most critical intraday support level for a flat-open BANKNIFTY session. A clean rejection at 58,000 with a bounce back above TC (58,117.61) is a high-probability long trade with a tight stop below 57,950 and target of PDH (58,247.95); a break below 58,000 with close confirmation is the highest-conviction short signal of the session. |
⚡ Key Trigger: **Two consecutive 30-minute closes above PDH (58,247.95) = bull trigger targeting H3 (58,463) and R1 (58,508.61); a single 30-minute close below TC (58,117.61) with subsequent break of OI-S (58,000) = bear confirmation targeting BC (57,856.95) and L4 (57,817.85)** — PDH (58,247.95) is the structural resistance because it was the maximum intraday price in the previous session, and sustained trading above it implies incremental demand; TC (58,117.61) is the structural support because it is the top boundary of the Ascending CPR and represents the minimum level bulls must defend to maintain intraday control. The OI-S at 58,000 adds a second layer of confirmation to any bearish trigger — bear trades are only high-conviction when both TC (58,117.61) AND OI-S (58,000) are broken on 30-minute closes.
SENSEX
Ascending — Narrow (0.05%)
▲ Bullish
|
Market Structure
Trending (up or down trend) |
Straddle
ATM 78,600 — Weekly straddle = 667.5 pts (Call 402.0 + Put 265.5), implying a one-standard-deviation move of approximately ±667.5 pts from 78,600 for the week expiry (06-Aug-2026), giving a range of roughly 77,932 to 79,267; notably, the Call premium (402.0) is higher than the Put premium (265.5), a rare inverted premium structure suggesting the market is pricing more upside risk than downside — this is a mildly bullish signal from the options market. |
Max Pain
Max Pain for week expiry (06-Aug-2026) = 78,500 — this sits just below BC (78,658.10) and within the CPR band, suggesting option sellers benefit from SENSEX gravitating toward 78,500 by week close; for 04 Aug intraday, this anchors expectations that SENSEX may struggle to sustain far above 78,696 (TC) unless a fresh catalyst drives volume. |
Tomorrow’s Complete Level Map
OI-R: 79,000 R3: 79,254.74 H6: 79,037.51 H5: 78,985.57 R2: 79,074.92 H4 ▶: 78,857.80 R1: 78,856.98 PDH: 78,895.10 H3 ↩: 78,748.41
TC: 78,696.22 P: 78,677.16 BC: 78,658.10
L3 ↩: 78,529.65 PDL: 78,497.34 S1: 78,459.22 L4 ▶: 78,420.26 S2: 78,279.40 L5: 78,292.49 L6: 78,240.55 S3: 78,061.46 OI-S: 78,000
↩ = Camarilla reversal point | ▶ = Camarilla breakout/breakdown trigger | OI-R/OI-S = Options wall (CE/PE max OI)
▲ Higher Open (Gap Up) — Open > Prev Close
▲ Bullish
Open lands: With SENSEX’s Ascending Narrow CPR (BC=78,658.10, TC=78,696.22, width only 38.12 points) positioned below yesterday’s close of 78,639.03, a gap-up open places SENSEX above TC (78,696.22) and above BC (78,658.10) — the Narrow CPR (0.05%) means the entire band is compressed into just 38 points, and a gap-up of even 0.05% clears the entire band, placing price in trending territory where the first 15-minute candle is decisive.
CPR role: Launch pad with extreme compression energy — the Narrow 0.05% CPR acts as a high-pressure spring; once price gaps above TC (78,696.22), the trend day probability increases dramatically and the CPR functions as an instant support base rather than a decision zone.
Minor Gap (0.05–0.25%) — Structure Dominant
A minor gap-up of 0.05–0.25% opens SENSEX between approximately 78,678 and 78,836, which clears TC (78,696.22) and opens near H3 (78,748.41) or approaching H4 (78,857.80) — for a Narrow CPR of just 0.05%, even a minor gap creates a significant structural breakout, as the CPR band is cleared in its entirety, activating the Narrow CPR trend day rule. Per Narrow CPR rules, the first 15-minute candle sets the session direction with extremely high probability; if the first 15-minute candle closes above H3 (78,748.41), the day is a bullish trend day targeting H4 (78,857.80) and R1 (78,856.98) — note that H4 (78,857.80) and R1 (78,856.98) are essentially the same level (just 0.82 points apart), creating an extremely powerful resistance confluence. Partial profits at the R1/H4 confluence (78,856.98–78,857.80), trail stop to TC (78,696.22), and second target at PDH (78,895.10) and H5 (78,985.57) approaching OI-R (79,000).
Significant Gap (0.25–0.5%) — Balanced
A significant gap-up of 0.25–0.50% opens SENSEX between approximately 78,836 and 79,031, placing the index at or above the critical R1/H4 confluence (78,856.98–78,857.80) and potentially approaching H5 (78,985.57), H6 (79,037.51), and the OI resistance at 79,000. This is an opening directly into the heaviest resistance zone of the session — R1 and H4 are nearly identical at 78,856.98 and 78,857.80, and H5 (78,985.57) and H6 (79,037.51) frame the OI wall at 79,000, making this a high-risk long entry zone. The Narrow CPR trending day dynamic remains active, but the gap-fill risk is elevated because SENSEX opens into three overlapping resistance levels; per Narrow CPR rules, the first 15-minute candle above H4 (78,857.80) with volume is the only clean long signal, while a 15-minute close below H3 (78,748.41) triggers a gap-fill short targeting TC (78,696.22) and BC (78,658.10).
Large Gap (>0.5%) — Gap Direction Dominant
A large gap-up of more than 0.50% opens SENSEX above approximately 79,031, at or above H6 (79,037.51) and the OI resistance at 79,000 — this is an opening above the CE max OI wall, a historically rare event that creates an immediate short-squeeze or violent mean-reversion scenario. CE writers at 79,000 face negative gamma pressure when SENSEX opens above their strike and must buy futures to hedge, creating an initial buy rush; however, this mechanical buying is typically exhausted within the first 15 minutes, after which a sharp reversal toward OI-R (79,000) and H5 (78,985.57) is the primary scenario. Abort level for longs is a 15-minute close back below 79,000 (OI-R) and H6 (79,037.51); if SENSEX sustains above 79,000, the monthly R2 (80,601.82) is the next major target but this requires exceptional volume confirmation.
|
▲ Upside Path → OI-R
TC (78,696.22) → H3 (78,748.41) → H4/R1 confluence (78,857.80/78,856.98) → PDH (78,895.10) → H5 (78,985.57) → H6 (79,037.51) → OI-R (79,000) — the R1/H4 confluence at 78,856.98–78,857.80 is the most powerful single resistance cluster in SENSEX today because two independent pivot systems converge within 0.82 points; genuine momentum through this level on above-average volume with a 15-minute candle close above 78,858 is the signal to target PDH (78,895.10) and H5 (78,985.57). Partial profits are mandatory at 78,857 and again at PDH (78,895.10); the OI wall at 79,000 is the session ceiling. |
▼ Downside Path → OI-S
Failure path: TC (78,696.22) → BC (78,658.10) → P (78,677.16) reversal → L3 (78,529.65) → PDL (78,497.34) → S1 (78,459.22) → L4 (78,420.26) → OI-S (78,000) — if the gap-up fails at TC (78,696.22) within the first 15 minutes, the Narrow CPR’s compressed energy releases to the downside instead, creating a sharp move toward L3 (78,529.65) and PDL (78,497.34) as the dominant intraday scenario. L3 (78,529.65) and PDL (78,497.34) are separated by only 32 points — this zone is a critical intraday support cluster where partial short-covering should occur. |
|
🔴 OI-R: The OI resistance at **79,000** (CE max OI for weekly expiry) is only about 361 points above yesterday’s close (78,639.03) — for a Narrow CPR Ascending trending day, 79,000 is the achievable session target if the gap-up trend day materialises. CE writers at 79,000 face increasing delta-hedge pressure as SENSEX approaches this level, meaning mechanical buy-hedging from CE writers paradoxically pushes price toward the strike before gamma reversal kicks in; traders should be alert to a sharp reversal after the first touch of 79,000. |
🟢 OI-S: The OI support at **78,000** (PE max OI for weekly expiry) sits approximately 639 points below yesterday’s close and is not an immediate intraday target in a gap-up scenario — however, it represents the PUT writers’ maximum defense zone for the week, meaning any decline toward 78,000 will encounter aggressive buying from PE writers who are covering and new call buyers entering the dip. For gap-up scenarios, 78,000 is the ultimate abort level: a daily close below 78,000 would completely invalidate the bullish weekly structure. |
⚡ Key Trigger: **First 15-minute candle close above TC (78,696.22) = bull trend trigger targeting H3 (78,748.41) and then the R1/H4 confluence at 78,856.98–78,857.80** — the Narrow CPR (0.05%) trend day rule requires only the FIRST 15-minute candle confirmation, making this the fastest confirmation rule of the three indices; this is the structural fulcrum because a Narrow CPR Ascending above the open means any sustained trading above TC (78,696.22) confirms a trend day with high probability. On the downside, a first 15-minute close below TC (78,696.22) and then below BC (78,658.10) confirms the gap-up is a bull trap, and SENSEX is headed back to P (78,677.16), L3 (78,529.65), and S1 (78,459.22).
▼ Lower Open (Gap Down) — Open < Prev Close
▼ Bearish
Open lands: A gap-down on SENSEX’s Ascending Narrow CPR (BC=78,658.10, TC=78,696.22) places the open below the entire CPR band — since the band is only 38.12 points wide, even a minor gap-down breaches the entire structure, placing price below BC (78,658.10) and in the zone between PDL (78,497.34) and L3 (78,529.65) for a moderate gap.
CPR role: Overhead resistance compression — the Narrow 0.05% CPR sitting above the gap-down open creates a concentrated overhead resistance zone; unlike Wide CPR days where there is room to recover within the band, the Narrow CPR means the entire band (BC to TC = 38 points) must be reclaimed quickly, or the Narrow CPR trend day dynamic activates to the downside.
Minor Gap (0.05–0.25%) — Structure Dominant
A minor gap-down of 0.05–0.25% opens SENSEX between approximately 78,442 and 78,600, which is below BC (78,658.10) and near L3 (78,529.65) to S1 (78,459.22) — for a Narrow CPR day, this is a significant breach because the entire 38-point CPR band is overhead. The Narrow CPR trend day rule activates in reverse: the first 15-minute candle close below BC (78,658.10) confirms a bearish trend day, targeting L3 (78,529.65), PDL (78,497.34), S1 (78,459.22), and then L4 (78,420.26) — minor gap-fills are less likely on Narrow CPR days than on Wide CPR days because the trend day dynamic means directional moves are sustained. However, a rapid gap-fill recovery above BC (78,658.10) within the first 15 minutes is the bull-recovery signal, with TC (78,696.22) as the next confirmation level; traders should give the gap-fill attempt exactly one 15-minute candle before committing directionally.
Significant Gap (0.25–0.5%) — Balanced
A significant gap-down of 0.25–0.50% opens SENSEX between approximately 78,443 and 78,600 (overlapping with the minor gap range given the Narrow CPR), placing the index at or below L3 (78,529.65) and approaching S1 (78,459.22) — this is an opening below multiple support levels simultaneously on a Narrow CPR trending structure, creating high-conviction bearish momentum. The Narrow CPR trending day rule means this gap-down is likely to extend rather than reverse, as trend days on Narrow CPR setups typically hold direction; the first 15-minute candle close below L3 (78,529.65) is the short-entry confirmation with targets at PDL (78,497.34), S1 (78,459.22), L4 (78,420.26), L5 (78,292.49), and ultimately OI-S (78,000). PUT writing community at 78,000 (weekly OI-S) will aggressively defend as price approaches, creating a potential sharp reversal zone near L5 (78,292.49) and L4 (78,420.26).
Large Gap (>0.5%) — Gap Direction Dominant
A large gap-down of more than 0.50% opens SENSEX below approximately 78,246, in the L5 (78,292.49) to L6 (78,240.55) zone and approaching the OI support at 78,000 — a gap this large on SENSEX would represent a 400+ point overnight decline, likely driven by a major macro catalyst. The Narrow CPR’s trend day dynamic on a large gap-down creates a high-probability bearish continuation session: the first 15-minute candle direction is critical, and any attempted recovery must clear BC (78,658.10) — approximately 400+ points above — to change the day’s bearish character, which is extremely unlikely in a large gap-down scenario. Partial short profits should be booked at L5 (78,292.49) and L6 (78,240.55); the OI support at 78,000 is the primary bear target and a high-conviction bounce zone from which intraday mean-reversion longs can be initiated with a tight stop below 77,900.
|
▲ Upside Path → OI-R
BC (78,658.10) → P (78,677.16) → TC (78,696.22) → H3 (78,748.41) → H4/R1 (78,857.80/78,856.98) → PDH (78,895.10) — the recovery sequence from a gap-down requires SENSEX to clear the entire Narrow CPR band (only 38 points wide) in one decisive move; a 15-minute close above TC (78,696.22) with volume is the only genuine recovery confirmation. The R1/H4 confluence at 78,856.98–78,857.80 remains the session ceiling on recovery; recovery longs should target this level and exit rather than holding for OI-R (79,000). |
▼ Downside Path → OI-S
L3 (78,529.65) → PDL (78,497.34) → S1 (78,459.22) → L4 (78,420.26) → L5 (78,292.49) → S2 (78,279.40) → L6 (78,240.55) → OI-S (78,000) — the bearish continuation path from a gap-down on a Narrow CPR trending day follows the Camarilla and Traditional levels in close sequence, with PDL (78,497.34) and S1 (78,459.22) as the first major cluster and L5/S2 (78,292.49/78,279.40) as the second significant cluster. Stop-losses from retail longs who bought yesterday’s close accelerate moves through L3 and PDL, and the OI support at 78,000 is the weekly expiry target where this bearish sequence terminates. |
|
🔴 OI-R: The OI resistance at **79,000** (CE max OI) is irrelevant in a gap-down scenario from an intraday perspective — CE writers are profitable as SENSEX moves away from 79,000, and they do not need to delta-hedge, removing a key source of buying pressure. The distance between a gap-down open and 79,000 (potentially 600–900 points) makes this level inaccessible in the same session, and traders should focus entirely on the BC/TC zone as the maximum intraday recovery target. |
🟢 OI-S: The OI support at **78,000** (PE max OI for weekly expiry) is the primary bear target in a gap-down scenario — PUT writers have built maximum open interest at this strike, meaning approaching 78,000 triggers both PUT holder profit-taking (buying back puts) and potential new call buying, creating a natural reversal zone. For SENSEX’s weekly expiry (06-Aug-2026), the 78,000 strike is the gravitational center for option sellers, and any intraday touch of this level should be treated as a high-probability bounce zone rather than a breakdown level, unless a major macro catalyst is driving exceptional volume. |
⚡ Key Trigger: **First 15-minute candle close below BC (78,658.10) confirms bearish trend day targeting L3 (78,529.65), S1 (78,459.22), and L4 (78,420.26)**; the Narrow CPR (0.05%) trend day rule means this is a SINGLE candle confirmation, not the two 30-minute closes required for Wide CPR indices — this single-candle rule makes SENSEX the fastest-moving of the three indices on trend days and requires faster stop-loss execution. Bull recovery trigger: a single 15-minute close above TC (78,696.22) from below is the only valid long entry in a gap-down scenario; partial longs can be taken at BC (78,658.10) with a stop below L3 (78,529.65), but full bull confirmation requires TC (78,696.22) to be reclaimed.
◆ Near Flat Open — Open ≈ Prev Close (±0.05%)
◆ Neutral
Open lands: A ±0.05% flat open places SENSEX between approximately 78,600 and 78,678 — this places the open inside the Narrow CPR band (BC=78,658.10 to TC=78,696.22), as the 38.12-point band contains the flat-open range; for a Narrow CPR of just 0.05%, this is the highest-information opening scenario, as the trend day direction will be determined entirely by the first 15-minute candle.
CPR role: Maximum compression — decision zone of highest precision: the Narrow 0.05% CPR with a flat open inside the band creates an energy compression at its most extreme; the 38-point band is the launching pad for a trending move, and whichever direction the first 15-minute candle breaks is the high-probability trend direction for the entire session.
Near Flat (±0.05%)
A flat open inside SENSEX’s Narrow Ascending CPR (BC=78,658.10 to TC=78,696.22) is the highest-probability trend day setup of the three indices being analysed — unlike NIFTY and BANKNIFTY with Wide CPRs requiring two 30-minute closes for confirmation, the Narrow CPR (0.05%) triggers its trend day signal from a SINGLE first 15-minute candle close, making SENSEX the most directional and fastest-confirming index on 04 Aug. The first 15-minute candle is the entire trade for a Narrow CPR flat-open scenario: a 15-minute close above TC (78,696.22) triggers a bullish trend day with targets at H3 (78,748.41), the R1/H4 confluence (78,856.98–78,857.80), and OI-R (79,000); a 15-minute close below BC (78,658.10) triggers a bearish trend day targeting L3 (78,529.65), S1 (78,459.22), L4 (78,420.26), and approaching OI-S (78,000). The Trending market structure label (from the data) further reinforces the trend day probability — SENSEX’s market structure is already classified as ‘Trending (up or down trend)’, meaning the session is predisposed to a sustained directional move rather than range oscillation. Both triggers carry equal weight in a flat open: **bull — first 15-minute close above TC (78,696.22) on above-average volume, targeting H3 (78,748.41) then R1/H4 confluence (78,857.80) then OI-R (79,000)**; **bear — first 15-minute close below BC (78,658.10) on above-average volume, targeting L3 (78,529.65) then S1 (78,459.22) then L4 (78,420.26) then OI-S (78,000)** — do not trade against the direction of the first 15-minute candle on a Narrow CPR day.
|
▲ Upside Path → OI-R
TC (78,696.22) → H3 (78,748.41) → H4/R1 confluence (78,857.80/78,856.98) → PDH (78,895.10) → H5 (78,985.57) → H6 (79,037.51) → OI-R (79,000) — the R1/H4 confluence at 78,856.98–78,857.80 is the single most important resistance cluster for SENSEX today, as two independent systems converge within 0.82 points; this level should be used for partial profits on any upside trend day. The OI ceiling at 79,000 is the session maximum for all realistic bullish scenarios; positions should be fully exited at H5 (78,985.57) to H6 (79,037.51) in anticipation of CE gamma resistance at 79,000. |
▼ Downside Path → OI-S
BC (78,658.10) → L3 (78,529.65) → PDL (78,497.34) → S1 (78,459.22) → L4 (78,420.26) → L5 (78,292.49) → S2 (78,279.40) → L6 (78,240.55) → OI-S (78,000) — the Narrow CPR bearish trend day sequence is fast and sustained; once the first 15-minute candle closes below BC (78,658.10), the move toward L3 (78,529.65) and PDL (78,497.34) typically occurs within the first 60 minutes of trading. The OI-S at 78,000 is 658 points below BC (78,658.10) — a move of this magnitude in a single session is at the upper end of the weekly straddle (667.5 pts), meaning 78,000 would represent the maximum session decline implied by current options pricing, making it both the bear target and the reversal zone. |
|
🔴 OI-R: The OI resistance at **79,000** (CE max OI for weekly expiry) is approximately 304 points above TC (78,696.22) — for a Narrow CPR trending day that starts flat and confirms bullish with the first 15-minute candle, 79,000 is a realistic intraday target achievable within a single session given the trending structure. CE writers at 79,000 will face gamma pressure as SENSEX approaches, and the mechanical delta-hedging (buying futures near the strike) creates a brief price push into 79,000 before sharp reversal; traders should exit longs at H5 (78,985.57) and re-evaluate before the 79,000 strike. |
🟢 OI-S: The OI support at **78,000** (PE max OI for weekly expiry) is approximately 658 points below TC (78,696.22) — for a Narrow CPR trending day that starts flat and confirms bearish with the first 15-minute candle, 78,000 is the realistic maximum downside target for the session, coinciding with the weekly straddle’s implied range floor. PUT writers at 78,000 will aggressively buy back puts as price approaches (reducing negative delta exposure), creating a natural mean-reversion bounce zone; intraday short traders should book profits at L5 (78,292.49) and L6 (78,240.55) well before 78,000 to avoid the snap-back risk from PUT writer covering. |
⚡ Key Trigger: **First 15-minute candle close above TC (78,696.22) = bull trend day trigger (Narrow CPR rule); first 15-minute candle close below BC (78,658.10) = bear trend day trigger** — unlike Wide CPR indices where two 30-minute closes are required, the Narrow CPR (0.05%) demands only ONE 15-minute confirmation, making this the most time-sensitive and conviction-heavy signal of the day across all three indices. The 38-point distance between BC (78,658.10) and TC (78,696.22) is the zone of maximum uncertainty — any trader caught inside this band during the first 15 minutes is in a no-man’s land and should wait for the breakout direction before committing capital.
📊 VIX Insight: India VIX data is unavailable for this session (shown as — with —% change), which creates a significant information gap for premium pricing, straddle fair-value assessment, and fear-gauge confirmation. In the absence of VIX data, traders must rely on straddle premiums as the primary volatility proxy: NIFTY weekly straddle at 185.75 points implies a contained, low-volatility environment for the expiry week, while SENSEX weekly straddle at 667.5 points (Call > Put) and BANKNIFTY monthly straddle at 1,395 points suggest moderate-to-elevated expected moves respectively. For 04 Aug, treat the straddle-implied ranges as the de-facto VIX substitute and avoid holding delta-heavy positions beyond the first traditional target levels until VIX data is restored.
Overall View:
All three indices closed at or near day highs on 03 Aug, establishing a broad bullish sentiment entering 04 Aug, but the structural landscape is mixed: NIFTY and BANKNIFTY carry Wide Ascending CPRs (0.35% and 0.45% respectively) that cap trend potential and favour range-bound, fade-the-extreme strategies, while SENSEX carries a Narrow Ascending CPR (0.05%) with a Trending market structure that is primed for a high-probability trend day the moment the first 15-minute candle breaks above TC (78,696.22) or below BC (78,658.10). The critical cross-index theme is the proximity of OI resistance levels — NIFTY at 25,000 (226 pts away), BANKNIFTY at 59,000 (752 pts away), and SENSEX at 79,000 (361 pts away from prev close) — creating a ceiling architecture that limits upside extension and makes fade-at-OI-resistance the highest-probability cross-index setup if markets open higher. Traders should prioritise confirmation rules strictly: one 15-minute candle for SENSEX, two 30-minute candles for NIFTY and BANKNIFTY, and treat any gap-up that opens directly into OI resistance as a distribution event rather than a breakout.
This analysis is for educational purposes only and is not investment advice.


Responses