
Index Research
Intraday Analysis for 18 Aug 2026
KRVFinMart17 August 202648 min
Educational/Derived AnalysisSource: KRVFinMart Research Desk (End-of-Day)As of 17 Aug 2026, 05:21 PM IST
Intraday Analysis for 18 Aug 2026
Markets closed with a mild bearish tilt on 17 Aug 2026 — NIFTY shed 0.32% to 24,287.65, SENSEX lost 0.36% to 77,728.16, while BANKNIFTY managed to hold nearly flat at 57,497.80 (+0.01%), suggesting bank stocks are acting as a relative cushion. India VIX data is unavailable for this session, which limits precise premium-sizing guidance, but the tight Descending–Narrow CPR structures across all three indices signal a high-probability trending day setup where the first 15-minute candle direction will be decisive. With weekly straddles pricing NIFTY at ±115.65 points and SENSEX at ±656 points, the options market expects contained but directional moves, and intraday traders should prioritise breakout-retest setups over mean-reversion fades until a clear structural pivot is established.
Key Market Signals — Intraday Setup
All three indices — NIFTY, BANKNIFTY, and SENSEX — carry Descending–Narrow CPR structures for 18 Aug 2026, placing their CPR bands entirely below yesterday's closing prices and unanimously signalling that the market is in seller-controlled territory entering the session. A flat-to-negative open across the board would leave price immediately at or below the Descending TC for each index, creating a synchronized bear setup that demands volume confirmation before any long bias is adopted.
Deep Technical Analysis & Levels
NIFTY
Descending — Narrow (Width 0.02%)
▼ Bearish
Market Structure Trending (up or down trend) | Straddle Weekly ATM 24300 straddle = 77.20 (Call) + 38.45 (Put) = **115.65 points** — implying an expected intraday range of approximately 24,184 on the downside and 24,416 on the upside from the ATM strike, keeping both Max Pain (24,350) and OI resistance (24,500) well within the upper band of that range. | Max Pain Weekly Max Pain = **24,350** — price is currently trading at 24,287.65, which is 62 points below Max Pain; option sellers will exert gravitational pull toward 24,350 into expiry, suggesting intraday longs targeting the CPR zone (24,289–24,293) have Max Pain alignment, but a sustained hold above 24,350 requires fresh buying conviction. |
Tomorrow's Complete Level Map
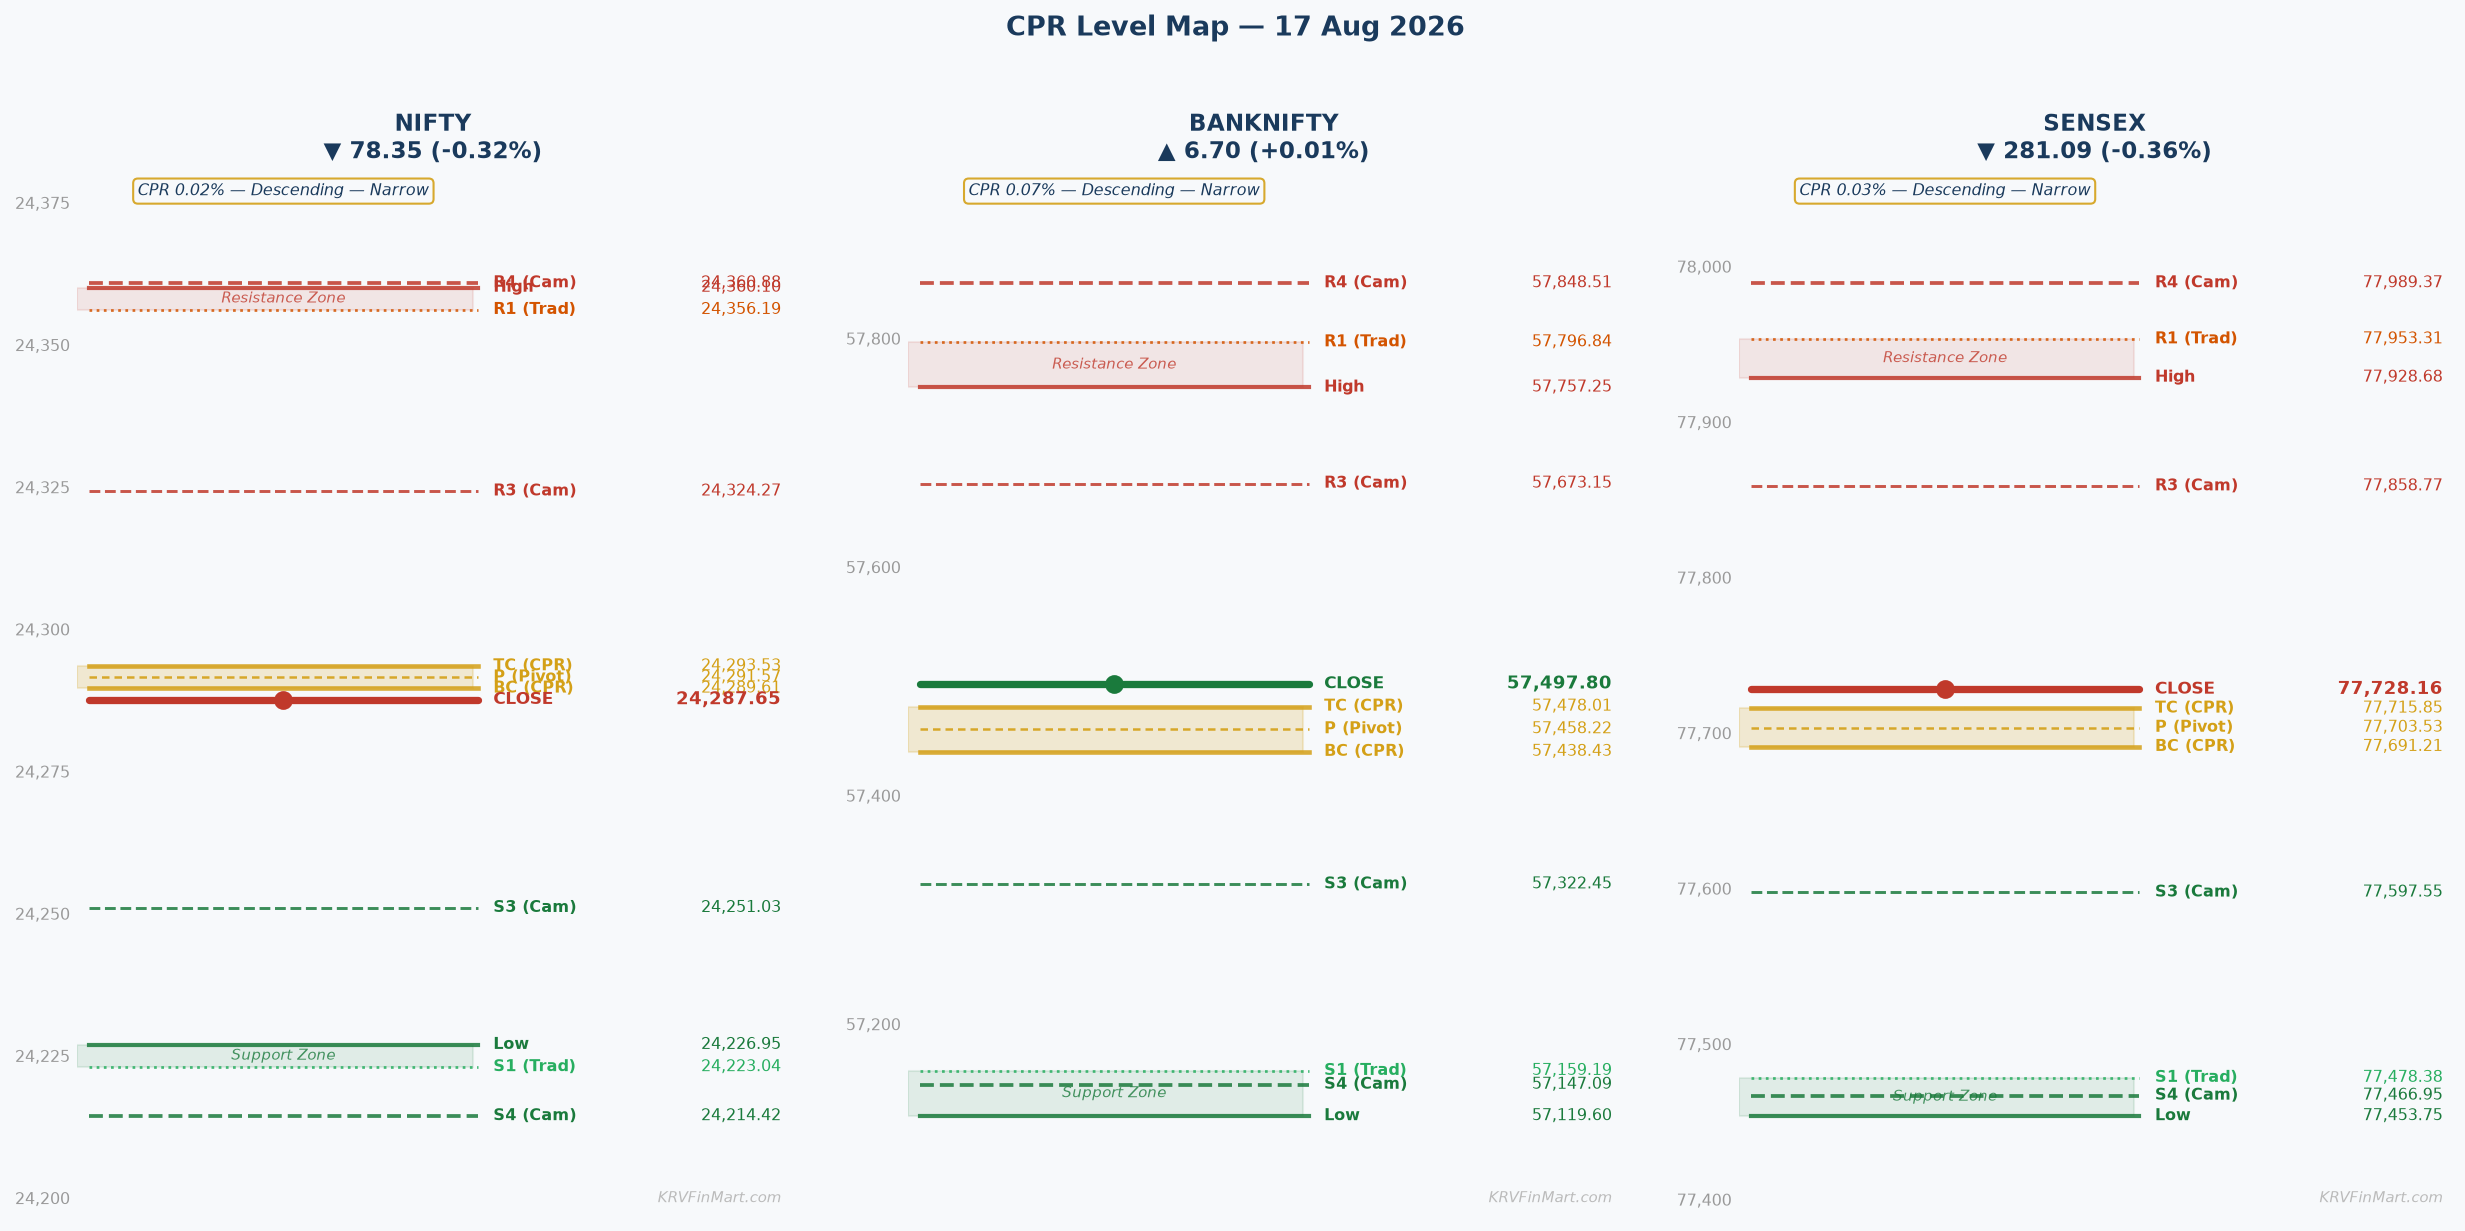
OI-R: 24,500 R3: 24,489.34 H6: 24,421.13 H5: 24,403.64 R2: 24,424.72 H4 ▶: 24,360.88 R1: 24,356.19 PDH: 24,360.10 H3 ↩: 24,324.27
TC: 24,293.53 P: 24,291.57 BC: 24,289.61
L3 ↩: 24,251.03 PDL: 24,226.95 S1: 24,223.04 L4 ▶: 24,214.42 S2: 24,158.42 L5: 24,171.66 L6: 24,154.17 S3: 24,089.89 OI-S: 24,000
↩ = Camarilla reversal point | ▶ = Camarilla breakout/breakdown trigger | OI-R/OI-S = Options wall (CE/PE max OI)
▲ Higher Open (Gap Up) — Open > Prev Close
▲ Bullish
Open lands: With a Descending CPR, the entire CPR band (BC 24,289.61 — TC 24,293.53) sits below yesterday's close of 24,287.65. A gap-up open above 24,287.65 means price opens above the entire Descending CPR band — above TC 24,293.53 — which is the strongest bullish outcome for this CPR structure, placing price in 'above Descending CPR' territory where the CPR flips from overhead resistance into an immediate support floor.
CPR role: Launch pad and immediate support floor — price above TC 24,293.53 means the Descending CPR band now acts as a cushion below; any intraday dip back toward TC 24,293.53 becomes a buy-the-dip opportunity rather than a resistance test.
Minor Gap (0.05–0.25%) — Structure Dominant
A minor gap up of 0.05–0.25% opens NIFTY in the range of approximately 24,300 to 24,349, placing price marginally above TC 24,293.53 and inside the Camarilla H3 zone at 24,324.27. The Descending–Narrow CPR structure (width just 0.02%) adds strong trend-day confirmation to even a minor gap — because the CPR band is so compressed, any price above TC 24,293.53 immediately puts bulls in control and the structure confirms the upside lean rather than conflicting with it. The first target in this scenario is Camarilla H3 at 24,324.27 (a 15-minute close above which confirms bullish momentum), followed by PDH 24,360.10 and Traditional R1 24,356.19 as the partial profit zone on the first leg.
Significant Gap (0.25–0.5%) — Balanced
A significant gap up of 0.25–0.5% opens NIFTY roughly in the 24,349–24,409 zone, pushing price above Traditional R1 (24,356.19) and potentially toward Camarilla H4 (24,360.88) or H5 (24,403.64) right at the open. At this opening level, gap-fill risk is moderate — the gap would need to retrace back through R1 24,356.19, PDH 24,360.10, and H3 24,324.27 before reaching the CPR band, so the band acts as a distant but intact support. Delta-hedging flow from short-Call positions near 24,400 will create selling pressure as price approaches H5 24,403.64, and traders should book partial profits near H5 and watch for a consolidation before targeting OI resistance at 24,500.
Large Gap (>0.5%) — Gap Direction Dominant
A large gap up exceeding 0.5% opens NIFTY above approximately 24,409, potentially inside or above Camarilla H5 (24,403.64) — a zone where aggressive Call writing kicks in, creating a powerful OI wall. At these levels, price is dangerously close to the OI Resistance at 24,500 (the CE max OI strike), and the probability of a gap-fill toward the CPR band (24,289–24,293) becomes material as traders short the opening euphoria. The weekly straddle implies a max move of only ~115 points, so a large gap eating up much of that range at the open dramatically reduces the reward-to-risk for chasers; the preferred play is to wait for a 30-minute consolidation above H4 24,360.88 and only add longs if 24,450 holds, targeting OI-R 24,500 with a stop at H4.
|
▲ Upside Path → OI-R **H3 24,324.27 → PDH/R1 cluster 24,356.19–24,360.88 (H4) → H5 24,403.64 → OI-R 24,500** — Camarilla H3 at 24,324.27 is the first stall reference where mean-reversion sellers will attempt to cap price; a 15-minute close above H3 with volume confirms genuine momentum toward the PDH/R1/H4 cluster between 24,356.19 and 24,360.88, which represents the primary partial-profit zone. Beyond that, H5 24,403.64 and H6 24,421.13 form the Camarilla upside target zone, and OI-R 24,500 is the ultimate ceiling where CE writers are most concentrated and supply is structurally overwhelming. |
▼ Downside Path → OI-S **Failure of TC 24,293.53 → P 24,291.57 → BC 24,289.61 → L3 24,251.03 → PDL 24,226.95 / S1 24,223.04 → OI-S 24,000** — a gap-up that fails to hold TC 24,293.53 on the first 15-minute close signals a bull trap; loss of BC 24,289.61 confirms the failure and triggers a move toward L3 24,251.03 where initial short-side demand may emerge. Below L3, PDL 24,226.95 and S1 24,223.04 form the next cluster, and a sustained breakdown below L4 24,214.42 opens the path toward L5 24,171.66 and eventually OI-S 24,000 where PE writers are protecting the floor. |
| 🔴 OI-R: **OI Resistance at 24,500** is the CE max OI strike for the weekly series, meaning the highest concentration of call writers is parked here — these participants have sold calls at 24,500 and will actively delta-hedge by selling futures as price approaches, creating a self-reinforcing ceiling effect. In a gap-up scenario where price is already elevated, the 24,500 OI wall becomes the primary fade zone; any rally that reaches 24,480–24,500 should be treated as a scalp-exit or short-entry region unless accompanied by extraordinary volume that signals institutional call-covering. | 🟢 OI-S: **OI Support at 24,000** is the PE max OI strike, representing the largest put-writing position in the weekly series — these put sellers need 24,000 to hold for their premium to expire worthless, and they will defend this level aggressively. In a gap-up scenario, 24,000 is distant and largely irrelevant as an intraday target unless a catastrophic unwind occurs; its primary role is as a structural abort level — if NIFTY were to collapse through 24,000, the PE writers would begin covering, amplifying the downside move significantly. |
⚡ Key Trigger: The critical trigger is a **first 15-minute candle close above TC 24,293.53** with above-average volume — this confirms that the Descending CPR has been fully overtaken and the band is functioning as support rather than resistance, activating the bullish path toward H3 24,324.27 and R1 24,356.19. Failure to sustain above TC 24,293.53 on the first 15-minute close — even in a gap-up scenario — is a warning sign that the gap is a bull trap, and price reverting below 24,289.61 (BC) would shift the day's structure decisively bearish toward L3 24,251.03.
▼ Lower Open (Gap Down) — Open < Prev Close
▼ Bearish
Open lands: With a Descending CPR, a gap-down open below yesterday's close of 24,287.65 places price below the entire CPR band (BC 24,289.61 to TC 24,293.53) — inside or below the Descending CPR structure. The entire CPR band now sits overhead as resistance, and bearish control is established from the first tick.
CPR role: Overhead resistance — the entire CPR band (BC 24,289.61 to TC 24,293.53) acts as a ceiling in this scenario; any intraday bounce that reaches BC 24,289.61 will face aggressive selling from participants who entered short positions anticipating the Descending CPR structure.
Minor Gap (0.05–0.25%) — Structure Dominant
A minor gap down of 0.05–0.25% opens NIFTY in the 24,226–24,275 range, placing price inside the prior day's range but below the entire CPR band, with BC 24,289.61 immediately overhead as resistance. Minor gaps in a Descending–Narrow CPR structure are high-probability bear setups — the CPR confirms directional bias, and gap-fill probability toward BC 24,289.61 is low on trend days; the market is more likely to drift lower toward L3 24,251.03 as the initial bear target. Traders should watch for a 15-minute close below L3 24,251.03 to confirm the bear case, with S1 24,223.04 and PDL 24,226.95 forming the next support cluster, and any failed bounce at BC 24,289.61 is a high-conviction short entry.
Significant Gap (0.25–0.5%) — Balanced
A significant gap down of 0.25–0.5% opens NIFTY roughly at 24,166–24,227, placing price at or below S1 24,223.04 and PDL 24,226.95 — breaching a key support cluster at the open and leaving the entire CPR band (24,289–24,293) as distant overhead resistance. The 30-minute reclaim rule applies here — if NIFTY cannot reclaim S1 24,223.04 within the first 30 minutes, the bear case extends toward L4 24,214.42 and then L5 24,171.66, while a decisive 30-minute close above S1 signals a potential gap-fill recovery toward P 24,291.57. PUT writers defending 24,000 will provide underlying support, but the significant gap opens room for L4 24,214.42 to be tested, and traders should use any bounce to BC 24,289.61 as a short entry rather than a long.
Large Gap (>0.5%) — Gap Direction Dominant
A large gap down exceeding 0.5% opens NIFTY below approximately 24,166, potentially at or below Camarilla L5 24,171.66 — a panic-zone level that triggers retail stop-losses and amplifies the downside move. In this scenario, VIX (currently unavailable) would be expected to spike significantly, premium values would inflate sharply, and the straddle's 115.65-point expected move would be exceeded at the open alone, signalling an extraordinary event. The recovery threshold is a 30-minute close back above L4 24,214.42; absent that, targets extend to L6 24,154.17 and S2 24,158.42, while OI-S 24,000 becomes the psychological and structural magnet for the session — option sellers defending 24,000 makes it the most likely stabilization point.
|
▲ Upside Path → OI-R **BC 24,289.61 → P 24,291.57 → TC 24,293.53 → H3 24,324.27 → R1 24,356.19 → OI-R 24,500** — the recovery path requires a confirmed 15-minute close above TC 24,293.53, which transforms the CPR band from resistance to support and opens the gap-fill trade toward H3 24,324.27 as the first genuine bullish target. Genuine recovery is confirmed only when price holds TC 24,293.53 on a retest, at which point R1 24,356.19 and the PDH 24,360.10 cluster become realistic intraday targets. |
▼ Downside Path → OI-S **L3 24,251.03 → PDL 24,226.95 / S1 24,223.04 → L4 24,214.42 → L5 24,171.66 → S2 24,158.42 / L6 24,154.17 → S3 24,089.89 → OI-S 24,000** — below L3 24,251.03, retail stop-losses trigger in bunches as PDL 24,226.95 and S1 24,223.04 are breached, accelerating the move toward L4 24,214.42 where Camarilla breakout-to-breakdown confirmation occurs, and L5 24,171.66 opens the door for S2 24,158.42 and L6 24,154.17 before the ultimate OI-S 24,000 support. |
| 🔴 OI-R: **OI Resistance at 24,500** acts as a distant overhead ceiling in the gap-down scenario — the CE writers at 24,500 are comfortable and their positions are deeply out of the money, so they provide no immediate market-moving pressure. However, the existence of this OI wall at 24,500 caps any intraday recovery rally, as participants know the real supply begins well above the CPR band, limiting the reward for counter-trend longs. | 🟢 OI-S: **OI Support at 24,000** is the critical structural floor in a gap-down scenario — the PE max OI strike has the largest concentration of put sellers who have collected premium betting 24,000 will hold, and as price approaches this level they will aggressively buy futures to defend their short-put positions. A move toward 24,000 represents both a straddle monetisation event (weekly puts near full value) and a structural support test; whether it triggers a bounce or accelerates lower depends entirely on whether those put writers cover (buying pressure) or capitulate (selling pressure). |
⚡ Key Trigger: The key trigger for a gap-down scenario is **failure to reclaim BC 24,289.61 within the first 15 minutes** — this confirms the Descending CPR is functioning as overhead resistance and the bear trend is in control, activating the path toward L3 24,251.03 and S1 24,223.04. Conversely, a bull trigger fires only if price manages a 15-minute close above TC 24,293.53 — that would signal a false breakdown and activates the gap-fill recovery path toward H3 24,324.27 and R1 24,356.19.
◆ Near Flat Open — Open ≈ Prev Close (±0.05%)
◆ Neutral
Open lands: A flat open within ±0.05% of yesterday's close of 24,287.65 places NIFTY in the range 24,275–24,299 — with the entire Descending CPR band (BC 24,289.61 to TC 24,293.53) sitting just above the lower bound of that range. Specifically, a flat open near 24,287.65 places price fractionally below BC 24,289.61, meaning the CPR band is immediately overhead and acting as the first resistance the market must clear.
CPR role: Decision zone and compression band — the ultra-narrow 0.02% CPR (width just 3.92 index points from BC 24,289.61 to TC 24,293.53) creates a high-tension compression band; in a Descending structure with a flat open, the CPR sits as an immediate overhead ceiling, and whichever side resolves first dictates the entire session's direction.
Near Flat (±0.05%)
A flat open near NIFTY's previous close of 24,287.65 in a Descending–Narrow CPR environment is one of the highest-information setups available to intraday traders — the first 15-minute candle is not just the trade, it IS the thesis. The CPR band (BC 24,289.61 to TC 24,293.53) is positioned just 2–5 points above the flat open, meaning bulls need to clear only 4–6 points to take control, while bears need price to stay below BC 24,289.61 to confirm the Descending structure's bearish intent. With a CPR width of just 0.02%, this is a textbook narrow CPR trend-day setup — statistical probability of a clean directional trend is elevated because there is so little contested CPR territory; price either accepts the CPR as support (bullish trend day) or as resistance (bearish trend day) within the first candle. The bull trigger is a 15-minute close above TC 24,293.53 targeting H3 24,324.27 → R1 24,356.19 → OI-R 24,500, while the bear trigger is a 15-minute close below BC 24,289.61 with sustained selling toward L3 24,251.03 → S1 24,223.04 → OI-S 24,000.
|
▲ Upside Path → OI-R **TC 24,293.53 → H3 24,324.27 → PDH 24,360.10 / R1 24,356.19 / H4 24,360.88 → H5 24,403.64 → OI-R 24,500** — once TC 24,293.53 is confirmed as support via a 15-minute close above it, the first target is Camarilla H3 24,324.27 where mean-reversion sellers will test conviction; volume-backed continuation above H3 opens the PDH/R1/H4 cluster (24,356–24,360) as the primary partial-profit zone, and beyond that H5 24,403.64 and OI-R 24,500 become achievable only on a genuine momentum trend day. |
▼ Downside Path → OI-S **BC 24,289.61 → L3 24,251.03 → PDL 24,226.95 / S1 24,223.04 → L4 24,214.42 → L5 24,171.66 → OI-S 24,000** — a confirmed 15-minute close below BC 24,289.61 activates the Descending CPR's full bearish potential; L3 24,251.03 is the first Camarilla mean-reversion support where bears may see partial covering, but below PDL 24,226.95 and S1 24,223.04 the path to L4 24,214.42 accelerates as retail stops are triggered, with OI-S 24,000 as the session's ultimate structural support. |
| 🔴 OI-R: **OI Resistance at 24,500** — in a flat-open scenario where price opens near 24,287.65, the OI wall at 24,500 is approximately 212 points away and represents the absolute ceiling for any bull trend day; CE writers at this strike are positioned to sell futures aggressively as NIFTY approaches 24,480–24,500, making it a zone to book full profits and avoid fresh longs. Given the weekly straddle implies only ±115 points of expected move, reaching OI-R 24,500 from a flat open would require a move nearly double the expected, which is a low-probability but high-reward outcome reserved only for strong gap-up follow-through sessions. | 🟢 OI-S: **OI Support at 24,000** — in a flat-open scenario, PE writers have positioned heavily at 24,000 to collect premium, and this level acts as the deep structural floor that bounds the entire bearish path; even in a bear trend day from a flat open, reaching 24,000 would require NIFTY to fall approximately 288 points (roughly 1.2%), which is beyond the straddle-implied move and would signal a rare panic session. The PE base at 24,000 provides psychological support to any breakdown scenario and limits the duration of short positions — traders should plan to cover shorts partially near L5 24,171.66 and fully near S3 24,089.89, before the 24,000 OI floor triggers aggressive put-seller buying. |
⚡ Key Trigger: **First 15-minute candle close above TC 24,293.53 = bull signal** targeting H3 24,324.27 immediately, with trailing toward R1 24,356.19 and OI-R 24,500; conversely, **first 15-minute candle close below BC 24,289.61 = bear signal** confirming the Descending CPR is acting as resistance, with targets at L3 24,251.03 and S1 24,223.04. These exact levels (TC 24,293.53 and BC 24,289.61) are the structural fulcrum because in a Descending–Narrow CPR, there is zero buffer between the two trigger lines — a mere 3.92 points separates a bullish trend day from a bearish one, making position clarity essential before entry.
BANKNIFTY
Descending — Narrow (Width 0.07%)
▼ Bearish
Market Structure Trending (up or down trend) | Straddle Monthly ATM 57500 straddle = 560.00 (Call) + 298.90 (Put) = **858.90 points** — implying a monthly expected move range of approximately 56,641 to 58,359 from the ATM strike, with the current price of 57,497.80 sitting almost exactly at the ATM, indicating options market is pricing maximum uncertainty at current levels. | Max Pain Monthly Max Pain = **57,800** — BANKNIFTY closed at 57,497.80, which is 302.20 points below Max Pain at 57,800; this gravitational pull from option sellers suggests the index has a structural tendency to drift upward toward 57,800 into monthly expiry on 25 Aug 2026, making intraday shorts above OI-S (57,000) risky for swing holds. |
Tomorrow's Complete Level Map
OI-R: 58,000 R3: 58,434.49 H6: 58,139.67 H5: 58,053.33 R2: 58,095.87 H4 ▶: 57,848.51 R1: 57,796.84 PDH: 57,757.25 H3 ↩: 57,673.15
TC: 57,478.01 P: 57,458.22 BC: 57,438.43
L3 ↩: 57,322.45 PDL: 57,119.60 S1: 57,159.19 L4 ▶: 57,147.09 S2: 56,820.57 L5: 56,942.27 L6: 56,855.93 S3: 56,521.54 OI-S: 57,000
↩ = Camarilla reversal point | ▶ = Camarilla breakout/breakdown trigger | OI-R/OI-S = Options wall (CE/PE max OI)
▲ Higher Open (Gap Up) — Open > Prev Close
▲ Bullish
Open lands: BANKNIFTY closed at 57,497.80 with a Descending CPR where TC = 57,478.01 — the entire CPR band (BC 57,438.43 to TC 57,478.01) sits below the previous close. A gap-up open above 57,497.80 places price above the entire Descending CPR band, overtaking TC 57,478.01 and putting bulls in immediate control, with the CPR band flipping to a support base below current price.
CPR role: Support launch pad — with price gapping above TC 57,478.01, the Descending CPR band (57,438.43–57,478.01) becomes an immediate demand zone below; any intraday pullback to TC 57,478.01 is a structured buy-the-dip opportunity in this scenario, as the 0.07% narrow CPR confirms a trending day bias strongly weighted to the upside.
Minor Gap (0.05–0.25%) — Structure Dominant
A minor gap up of 0.05–0.25% opens BANKNIFTY in the range of approximately 57,527–57,641, placing price above TC 57,478.01 but below Camarilla H3 57,673.15, setting up an orderly bullish structure where the CPR is support and H3 is the first target. The Descending–Narrow CPR at 0.07% strongly confirms the trending bias in a gap-up scenario — this is the 'Descending Trend Reversal' sub-pattern where price opens above the entire downward-sloping CPR, meaning two sessions of CPR data are now below price, signalling structural trend strength. The first 15-minute candle close above TC 57,478.01 confirms the trade; the initial target is H3 57,673.15, with a partial profit at R1 57,796.84 and continuation toward PDH 57,757.25 and H4 57,848.51.
Significant Gap (0.25–0.5%) — Balanced
A significant gap up of 0.25–0.5% opens BANKNIFTY in the range 57,641–57,785, placing price between Camarilla H3 (57,673.15) and approaching the PDH (57,757.25) and R1 (57,796.84) cluster — a zone where overnight shorts will aggressively defend their positions and create selling pressure. The gap-fill risk here is significant because price opens into the H3 mean-reversion zone (57,673.15) immediately, and if the first 15-minute candle cannot hold above H3 57,673.15, a retracement toward TC 57,478.01 is likely before any re-attempt higher. Delta-hedging flows from Call writers near 58,000 (OI-R) will intensify as price approaches H4 57,848.51 and R1 57,796.84; traders should take partial profits in the 57,800–57,848 zone and monitor for a 15-minute consolidation before targeting OI-R 58,000.
Large Gap (>0.5%) — Gap Direction Dominant
A large gap up exceeding 0.5% opens BANKNIFTY above approximately 57,785, potentially at or above PDH 57,757.25, H4 57,848.51, or even approaching OI-R 58,000 — a zone where CE writers with the largest open interest are positioned to sell rallies. In this scenario, the monthly straddle at 858.90 points would be rapidly depleted on the upside, creating significant gamma exposure for option sellers who will aggressively hedge by selling futures near OI-R 58,000. The preferred approach is to wait for 30-minute consolidation above H4 57,848.51 before initiating longs toward OI-R 58,000 with a strict stop at H3 57,673.15; gap-fill toward TC 57,478.01 is the abort scenario and should be treated as a failed gap-up.
|
▲ Upside Path → OI-R **TC 57,478.01 → H3 57,673.15 → PDH 57,757.25 / R1 57,796.84 → H4 57,848.51 → OI-R 58,000 → H5 58,053.33** — Camarilla H3 at 57,673.15 is the first stall point where mean-reversion sellers emerge; a volume-backed 15-minute close above H3 confirms genuine momentum toward the critical PDH/R1/H4 cluster (57,757–57,848), which is the primary partial-profit zone for intraday traders. The OI-R at 58,000 is the maximum extension target, where CE writers are most concentrated; H5 58,053.33 beyond it becomes achievable only on extraordinary momentum. |
▼ Downside Path → OI-S **TC 57,478.01 → P 57,458.22 → BC 57,438.43 → L3 57,322.45 → PDL 57,119.60 / S1 57,159.19 → OI-S 57,000** — a gap-up that fails TC 57,478.01 on the first 15-minute close signals a bull trap; sustained selling below BC 57,438.43 opens L3 57,322.45 as the immediate bear target, and below the PDL/S1 cluster (57,119–57,159), L4 57,147.09 signals Camarilla breakdown confirmation toward OI-S 57,000. |
| 🔴 OI-R: **OI Resistance at 58,000** is the CE max OI strike for the BANKNIFTY monthly series — the highest concentration of call writers have sold the 58,000 CE, and as price approaches this level, these participants delta-hedge by selling futures, creating a systematic supply response that is amplified by gamma as price draws closer. In a gap-up scenario, 58,000 is the ceiling where fresh longs should be exited and short-scalp opportunities emerge; only a monthly closing above 58,000 would signal a structural breakout beyond this OI wall. | 🟢 OI-S: **OI Support at 57,000** is the PE max OI strike, where put writers are heavily positioned to protect the 57,000 level through monthly expiry on 25 Aug 2026 — in a gap-up scenario, this level is the distant abort/stop reference, and reaching 57,000 would indicate a catastrophic gap-up reversal that invalidates all bullish thesis. The proximity of the current price (57,497.80) to OI-S 57,000 (only 498 points below) means intraday traders must monitor this level carefully — if BANKNIFTY loses 57,000 on a gap-up reversal day, put sellers covering will amplify the downside significantly. |
⚡ Key Trigger: The critical trigger for a gap-up BANKNIFTY session is a **first 15-minute candle close above TC 57,478.01 with above-average volume** — in a Descending CPR where the band should naturally attract sellers, a clear 15-minute hold above TC 57,478.01 signals that the structural trend reversal is genuine and buyers are in control through the session's most critical decision window. Failure to hold TC 57,478.01 on the first 15-minute close — even after a gap-up open — flags a potential gap-fill move back toward BC 57,438.43 and ultimately L3 57,322.45, reversing the gap-up bullish thesis entirely.
▼ Lower Open (Gap Down) — Open < Prev Close
▼ Bearish
Open lands: BANKNIFTY closed at 57,497.80 with TC at 57,478.01 — the entire Descending CPR band (BC 57,438.43 to TC 57,478.01) is just below the close. A gap-down open below 57,497.80 means price opens at or inside the CPR band (if gap is minor) or below BC 57,438.43 (if gap is significant/large), with the entire band immediately overhead as resistance.
CPR role: Overhead resistance and trap door — in a gap-down Descending CPR scenario, the entire band (57,438.43–57,478.01) sits above the opening price as a resistance ceiling; any bounce attempt toward BC 57,438.43 will face concentrated selling from participants playing the Descending structure.
Minor Gap (0.05–0.25%) — Structure Dominant
A minor gap down of 0.05–0.25% opens BANKNIFTY in the 57,355–57,469 range, placing price inside the CPR band or just below BC 57,438.43, with TC 57,478.01 as immediate overhead resistance. The Descending–Narrow CPR structure at 0.07% confirms bear intent even on a minor gap — this is not a random noise gap but a structure-aligned gap that confirms the prior session's inability to hold above the CPR band. Traders should watch BC 57,438.43 as the critical resistance — any 15-minute close that fails to reclaim BC confirms the bear case toward L3 57,322.45 and S1 57,159.19, while a recovery above TC 57,478.01 would flip the setup to neutral.
Significant Gap (0.25–0.5%) — Balanced
A significant gap down of 0.25–0.5% opens BANKNIFTY in approximately 57,211–57,354, placing price between Camarilla L3 (57,322.45) and approaching S1 (57,159.19) — a zone that represents meaningful bearish territory where Camarilla mean-reversion support first emerges. The 30-minute reclaim rule applies — failure to recover above BC 57,438.43 within 30 minutes of open confirms the Descending CPR's bearish dominance and extends the move toward L4 57,147.09 and PDL 57,119.60. Put writers at OI-S 57,000 will begin defending aggressively as price approaches 57,050–57,100, providing a cushion, but the 30-min failure scenario targets S2 56,820.57 and L5 56,942.27 before finding structural support.
Large Gap (>0.5%) — Gap Direction Dominant
A large gap down exceeding 0.5% opens BANKNIFTY below approximately 57,211, potentially near or below OI-S 57,000 — the critical PE max OI strike where put sellers have their maximum exposure. In this scenario, the 858.90-point monthly straddle begins monetizing rapidly on the put side, and the key question becomes whether OI-S 57,000 triggers a bounce (put sellers buying futures to delta-hedge) or whether panic selling overwhelms the support. A 30-minute close below OI-S 57,000 is a catastrophic signal that targets L5 56,942.27, L6 56,855.93, and S2 56,820.57 in succession, and recovery requires a two 30-minute close rule above L4 57,147.09 before bulls can credibly attempt a recovery toward BC 57,438.43.
|
▲ Upside Path → OI-R **BC 57,438.43 → P 57,458.22 → TC 57,478.01 → H3 57,673.15 → R1 57,796.84 → OI-R 58,000** — the recovery path in a gap-down scenario begins with price reclaiming BC 57,438.43 on a 15-minute close, signalling that the Descending CPR band is being absorbed; once TC 57,478.01 is cleared and held on a retest, the gap-fill recovery toward H3 57,673.15 and R1 57,796.84 becomes the primary bull trade. Genuine recovery is confirmed only when the PDH 57,757.25 zone is cleared with volume, at which point OI-R 58,000 becomes the session ceiling. |
▼ Downside Path → OI-S **L3 57,322.45 → PDL 57,119.60 / S1 57,159.19 → L4 57,147.09 → OI-S 57,000 → L5 56,942.27 → S2 56,820.57 / L6 56,855.93** — below L3 57,322.45, retail stop-loss clusters below the prior day's low (57,119.60) trigger a wave of selling that accelerates through L4 57,147.09 (Camarilla breakdown trigger) toward OI-S 57,000, where put sellers attempt a defence. A break below OI-S 57,000 with volume is a high-impact event that targets L5 56,942.27 and S2 56,820.57 rapidly. |
| 🔴 OI-R: **OI Resistance at 58,000** — in a gap-down scenario, the CE wall at 58,000 is over 500 points away from current prices and acts as a distant ceiling that limits any recovery rally's ambition; call writers at 58,000 are comfortable and will not create near-term supply pressure, allowing modest recoveries toward H3 57,673.15 or R1 57,796.84 without OI-R interference. However, the existence of this ceiling means that even if a gap-down recovery occurs, position sizes for longs should be scaled with the understanding that 58,000 is where all upside momentum terminates. | 🟢 OI-S: **OI Support at 57,000** is the most critical level in any BANKNIFTY gap-down scenario — put writers at this monthly max OI strike have the largest open interest position, and their delta-hedging behavior (buying futures as 57,000 approaches) can trigger a powerful intraday bounce that shorts need to anticipate and respect. Whether 57,000 acts as a bounce catalyst or a breakdown trigger depends entirely on whether the put sellers cover (buying flow) or capitulate (selling flow) — in a mild gap-down scenario the bounce is more likely, while in a panic gap-down the breakdown risk is elevated. |
⚡ Key Trigger: **Failure to reclaim BC 57,438.43 within the first 15 minutes** is the primary bear confirmation — in a Descending CPR structure, the BC is the last line of the CPR band and a sustained hold below it means the entire band is overhead resistance, activating the full bear sequence toward L3 57,322.45 and OI-S 57,000. The bull trigger is a **15-minute close above TC 57,478.01** — this is the harder ask in a gap-down scenario but is the only confirmation that the gap is a fakeout and recovery toward H3 57,673.15 is possible.
◆ Near Flat Open — Open ≈ Prev Close (±0.05%)
◆ Neutral
Open lands: BANKNIFTY closed at 57,497.80, and TC is at 57,478.01 — a flat open within ±0.05% of the close places price in the range 57,469–57,526. This means a flat open lands very near TC 57,478.01 (just above or just below), right at the upper edge of the Descending CPR band, creating an immediate decision point at the most structurally significant level of the day.
CPR role: Decision zone and compression fulcrum — the 0.07% Narrow CPR (width 39.58 points from BC 57,438.43 to TC 57,478.01) creates a tight but tradeable compression band; in a Descending structure with a flat open near TC 57,478.01, this is the precise level where bullish vs bearish resolution occurs — a hold above TC is a Descending Trend Reversal setup, while a failure below BC is a full Descending CPR bear confirmation.
Near Flat (±0.05%)
A flat open for BANKNIFTY near 57,497.80 in a Descending–Narrow CPR environment is an extremely high-conviction setup because the flat open lands almost exactly at TC 57,478.01 — within 20 points — making the first 15-minute candle the single most important trading decision of the session. The CPR band at 0.07% (39.58 points wide) is narrow enough to generate a trending day but wide enough to allow a brief 15-minute consolidation; the market's resolution above TC 57,478.01 or below BC 57,438.43 will determine whether the Descending CPR acts as a resistance ceiling (bear day) or gets overtaken as a support floor (bull day). With BANKNIFTY holding nearly flat (+0.01%) on the previous session and the monthly Max Pain at 57,800 (302 points above current price), there is a gravitational pull upward from option sellers, which adds a slight bullish lean to the flat-open scenario — but the Descending CPR structure itself is bearish, creating a genuine conflict that only price action can resolve. The bull trigger is a 15-minute close above TC 57,478.01 targeting H3 57,673.15 → R1 57,796.84 → OI-R 58,000, while the bear trigger is a 15-minute close below BC 57,438.43 targeting L3 57,322.45 → S1 57,159.19 → OI-S 57,000.
|
▲ Upside Path → OI-R **TC 57,478.01 → H3 57,673.15 → PDH 57,757.25 / R1 57,796.84 → Max Pain 57,800 → H4 57,848.51 → OI-R 58,000** — once TC 57,478.01 is confirmed as support on a 15-minute close, the first leg targets H3 57,673.15 (195 points above TC), where mean-reversion sellers will test conviction; volume-backed continuation above H3 brings price into the critical PDH/R1/Max Pain cluster (57,757–57,800), which represents both a technical and OI-derived target zone, and the final extension targets H4 57,848.51 and OI-R 58,000 on an extraordinary trend day. Narrow CPR trend days in BANKNIFTY can be aggressive — the 0.07% width suggests minimal CPR friction, and once direction is established, each Camarilla level acts as a brief pause rather than a hard reversal. |
▼ Downside Path → OI-S **BC 57,438.43 → L3 57,322.45 → PDL 57,119.60 / S1 57,159.19 → L4 57,147.09 → OI-S 57,000 → L5 56,942.27** — a confirmed 15-minute close below BC 57,438.43 activates the Descending CPR's full bearish architecture; L3 57,322.45 is the first Camarilla mean-reversion support (116 points below BC) where initial covering may slow the move, but PDL 57,119.60 and S1 57,159.19 represent the next critical cluster, and L4 57,147.09 is the Camarilla breakdown trigger below which OI-S 57,000 becomes the magnet. Below 57,000, L5 56,942.27 and L6 56,855.93 are the extreme downside targets for a full bear trend day. |
| 🔴 OI-R: **OI Resistance at 58,000** — in a flat-open scenario where BANKNIFTY opens at ~57,497, OI-R 58,000 is approximately 503 points away and represents the absolute ceiling for any bull trend day that develops; CE writers at 58,000 will begin delta-hedging with futures sales well before price reaches this level, creating a supply gradient that intensifies from H4 57,848.51 onward. Traders should treat 57,800–57,848 (R1 and H4) as the primary profit-taking zone for longs and reserve the 58,000 target only for extraordinary momentum days where volume confirms institutional buying. | 🟢 OI-S: **OI Support at 57,000** — put writers at the 57,000 PE max OI strike are heavily positioned and will defend this level through monthly expiry; in a flat-open scenario, OI-S 57,000 is 498 points below the current price, making it the ultimate bear-trend-day target that is achievable only if L3 57,322.45 and L4 57,147.09 are both decisively breached on volume. The PE base at 57,000 provides a structural reason for bears to book profits near L4 57,147.09 and for bulls to find support at 57,000 — traders should not hold aggressive short positions below 57,050 into the close as put-seller covering will create violent upside swings. |
⚡ Key Trigger: **First 15-minute candle close above TC 57,478.01 = bull trend day signal**, targeting H3 57,673.15 as the immediate first target and R1 57,796.84 as the Max Pain convergence zone — the 302-point gap between current price and Max Pain (57,800) makes this the highest-probability bull target on a flat-open trend day. **First 15-minute candle close below BC 57,438.43 = bear trend day signal**, confirming the Descending CPR's overhead resistance function and activating the path toward L3 57,322.45 and ultimately OI-S 57,000 — the structural significance of these exact levels (57,478.01 and 57,438.43) is that they represent the mathematical boundary between multi-session bull trend continuation and bear trend continuation.
SENSEX
Descending — Narrow (Width 0.03%)
▼ Bearish
Market Structure Trending (up or down trend) | Straddle Weekly ATM 77700 straddle = 437.65 (Call) + 218.50 (Put) = **656.15 points** — implying an expected intraday range of approximately 77,044 on the downside and 78,356 on the upside from the ATM strike, with weekly Max Pain at 77,900 just 172 points above the current close. | Max Pain Weekly Max Pain = **77,900** — SENSEX closed at 77,728.16, which is 171.84 points below Max Pain; option sellers have a strong incentive to gravitationally pull SENSEX toward 77,900 before the weekly expiry on 20 Aug 2026, creating a mild upside magnetic effect that intraday bulls can lean on when price action is constructive above TC 77,715.85. |
Tomorrow's Complete Level Map
OI-R: 79,000 R3: 78,428.24 H6: 78,204.77 H5: 78,141.91 R2: 78,178.46 H4 ▶: 77,989.37 R1: 77,953.31 PDH: 77,928.68 H3 ↩: 77,858.77
TC: 77,715.85 P: 77,703.53 BC: 77,691.21
L3 ↩: 77,597.55 PDL: 77,453.75 S1: 77,478.38 L4 ▶: 77,466.95 S2: 77,228.60 L5: 77,314.41 L6: 77,251.55 S3: 77,003.45 OI-S: 75,000
↩ = Camarilla reversal point | ▶ = Camarilla breakout/breakdown trigger | OI-R/OI-S = Options wall (CE/PE max OI)
▲ Higher Open (Gap Up) — Open > Prev Close
▲ Bullish
Open lands: SENSEX closed at 77,728.16 with TC at 77,715.85 — the entire Descending CPR band (BC 77,691.21 to TC 77,715.85) sits below yesterday's close. A gap-up open above 77,728.16 places price above the entire Descending CPR band, overtaking TC 77,715.85, and in the 'Descending Trend Reversal' scenario where the CPR band flips from resistance to support immediately below the opening price.
CPR role: Launch pad and support floor — with price gapping above TC 77,715.85, the Descending CPR band (77,691.21–77,715.85) transitions into an immediate demand zone below; any dip back toward TC 77,715.85 is a structured long opportunity in a gap-up scenario, confirming the narrow 0.03% CPR's high-probability trending day character.
Minor Gap (0.05–0.25%) — Structure Dominant
A minor gap up of 0.05–0.25% opens SENSEX in approximately 77,767–77,922, placing price above TC 77,715.85 and approaching the Camarilla H3 zone (77,858.77) or the PDH/R1 cluster (77,928.68–77,953.31). The Descending–Narrow CPR at just 0.03% (24.64 points wide) provides maximum trending confirmation to a minor gap — the CPR band is so compressed that any price above TC 77,715.85 puts bulls in uncontested control, and the structure amplifies the minor gap's bullish lean rather than creating conflict. The first target is Camarilla H3 77,858.77 (a 15-minute close above confirms bull momentum), followed by PDH 77,928.68 and R1 77,953.31 as the primary partial-profit zone aligned with weekly Max Pain at 77,900.
Significant Gap (0.25–0.5%) — Balanced
A significant gap up of 0.25–0.5% opens SENSEX in approximately 77,922–78,117, placing price between the PDH/R1 cluster (77,928–77,953) and H5 78,141.91 — a zone where mean-reversion sellers will emerge after a near-test of PDH. Gap-fill risk increases meaningfully in this range because price is opening into the Camarilla H3–H4 zone (77,858–77,989) and approaching the PDH 77,928.68, where overnight short-sellers will defend; delta-hedging from CE writers near OI-R 79,000 is not yet a factor at this distance, so the primary friction is at H4 77,989.37 and R1 77,953.31. Partial profits should be taken near R1 77,953.31, and a 30-minute consolidation above H3 77,858.77 is needed before adding to longs targeting H5 78,141.91.
Large Gap (>0.5%) — Gap Direction Dominant
A large gap up exceeding 0.5% opens SENSEX above approximately 78,117, potentially inside or above H5 78,141.91 or approaching H6 78,204.77 and R2 78,178.46 — a zone where the gap is eating deeply into the weekly straddle's 656-point expected range. At these extreme opening levels, gap-fill probability toward TC 77,715.85 and even BC 77,691.21 becomes material, as the risk-reward for chasing longs collapses and smart money fades the opening euphoria. The preferred approach is to wait for two 30-minute closes above H4 77,989.37 before committing to longs targeting H6 78,204.77 and R2 78,178.46; OI-R 79,000 is a distant target that requires a truly exceptional session.
|
▲ Upside Path → OI-R **TC 77,715.85 → H3 77,858.77 → PDH 77,928.68 / Max Pain 77,900 / R1 77,953.31 → H4 77,989.37 → H5 78,141.91 → H6 78,204.77 / R2 78,178.46 → R3 78,428.24 → OI-R 79,000** — the first leg from TC to H3 (143 points) is the cleanest trade on a gap-up trending day; H3 77,858.77 is the mean-reversion stall point, and a volume-backed 15-minute close above H3 confirms momentum toward the Max Pain/R1/PDH cluster (77,900–77,953), which is the primary partial-profit zone for weekly expiry dynamics. Beyond H4 77,989.37, H5 and H6 (78,141–78,204) represent the Camarilla upside target zone, and OI-R 79,000 is the structural ceiling only reachable on an extraordinary trend day. |
▼ Downside Path → OI-S **TC 77,715.85 → P 77,703.53 → BC 77,691.21 → L3 77,597.55 → PDL 77,453.75 / S1 77,478.38 / L4 77,466.95 → L5 77,314.41 → OI-S 75,000** — a gap-up that fails TC 77,715.85 within the first 15 minutes signals a bull trap; loss of BC 77,691.21 confirms full CPR resistance and the bear path opens toward L3 77,597.55, then the PDL/S1/L4 cluster (77,454–77,479), and ultimately OI-S 75,000 as the monthly structural floor. |
| 🔴 OI-R: **OI Resistance at 79,000** is the weekly CE max OI strike — the highest concentration of call writers for the SENSEX weekly series has sold the 79,000 call, and their delta-hedging through futures selling creates an increasingly powerful supply ceiling as price approaches this level. In a gap-up scenario where SENSEX opens around 77,728–78,000, OI-R 79,000 is over 1,000 points away and is not an immediate intraday concern, but it caps the ultimate extension of any bull rally and should be the absolute exit target for any intraday long positions. | 🟢 OI-S: **OI Support at 75,000** — the SENSEX monthly PE max OI strike is a distant but critical structural floor; in a gap-up scenario, 75,000 is nearly 2,728 points below current price and is irrelevant as an intraday concern. Its primary analytical role is as context for PUT writers' conviction — the fact that 75,000 is the PE max OI strike indicates put sellers are comfortable and do not see structural downside risk below 75,000, which supports the overall bullish structural context of the session. |
⚡ Key Trigger: The primary trigger is a **first 15-minute candle close above TC 77,715.85 with above-average volume** — this confirms the Descending CPR has been structurally overtaken and the band is now support, validating the gap-up bull case toward H3 77,858.77 and the Max Pain/R1 zone at 77,900–77,953. Failure to sustain above TC 77,715.85 on the first 15-minute close signals a bull trap even in a gap-up scenario, and a close below BC 77,691.21 would shift the session firmly bearish toward L3 77,597.55 and eventually OI-S 75,000.
▼ Lower Open (Gap Down) — Open < Prev Close
▼ Bearish
Open lands: SENSEX closed at 77,728.16 with TC at 77,715.85 — the Descending CPR band (BC 77,691.21 to TC 77,715.85) is just below the close. A gap-down open below 77,728.16 places price at or inside the CPR band (minor gap) or below BC 77,691.21 (significant/large gap), with the entire CPR band overhead as resistance from the first tick.
CPR role: Overhead resistance and trap door — the Descending CPR band (77,691.21–77,715.85) acts as immediate overhead resistance in a gap-down scenario; any intraday bounce toward BC 77,691.21 meets sellers defending the Descending structure, and the narrow 0.03% width means there is minimal congestion zone above — price either reclaims the band decisively or gets rejected back down rapidly.
Minor Gap (0.05–0.25%) — Structure Dominant
A minor gap down of 0.05–0.25% opens SENSEX in the range 77,534–77,689, placing price just below BC 77,691.21 or inside the lower portion of the CPR band, with TC 77,715.85 as the immediate overhead resistance ceiling. The Descending–Narrow CPR structure confirms bear intent even on a minor gap — this is a structure-aligned gap that reinforces the two-session bearish CPR narrative, and the high-probability call is that the CPR band will act as resistance rather than being reclaimed. Traders should watch BC 77,691.21 as the key resistance — failure to close above BC on the first 15-minute candle confirms the bear case toward L3 77,597.55 and the PDL/S1/L4 cluster (77,453–77,479), while a recovery close above TC 77,715.85 would flip the setup bullish toward H3 77,858.77.
Significant Gap (0.25–0.5%) — Balanced
A significant gap down of 0.25–0.5% opens SENSEX in approximately 77,340–77,534, placing price between Camarilla L3 (77,597.55) and L4 (77,466.95), breaching key intraday support zones and leaving the entire CPR band (77,691–77,715) as distant overhead resistance. The 30-minute reclaim rule applies — failure to recover above BC 77,691.21 within 30 minutes confirms the bear extension toward L4 77,466.95 and PDL 77,453.75 / S1 77,478.38 / L4 77,466.95 cluster, which is a powerful support zone that may temporarily slow the decline. PUT writers at OI-S 75,000 are not yet a factor at these levels; the more relevant support is S1 77,478.38 and L4 77,466.95, beyond which L5 77,314.41 becomes the next target on sustained selling.
Large Gap (>0.5%) — Gap Direction Dominant
A large gap down exceeding 0.5% opens SENSEX below approximately 77,340, potentially approaching or breaching L5 77,314.41 and L6 77,251.55 — extreme Camarilla levels that signal a panic-driven sell-off. In this scenario, the weekly straddle's 656-point expected range is being consumed rapidly, and intraday PUT strategies monetize quickly; the critical recovery threshold is a two 30-minute close rule above L4 77,466.95, absent which S2 77,228.60 and L6 77,251.55 become the next targets with S3 77,003.45 as the ultimate intraday bear case. OI-S 75,000 — while structurally the floor — is 2,700+ points away and cannot serve as a realistic intraday target even in a large gap-down event.
|
▲ Upside Path → OI-R **BC 77,691.21 → P 77,703.53 → TC 77,715.85 → H3 77,858.77 → Max Pain 77,900 / R1 77,953.31 / PDH 77,928.68 → OI-R 79,000** — the recovery trade begins with a 15-minute close reclaiming BC 77,691.21, signalling the Descending CPR band is being absorbed; once TC 77,715.85 is cleared and holds on a retest, the gap-fill toward H3 77,858.77 is the primary bull trade, with the Max Pain/R1/PDH cluster (77,900–77,953) as the natural profit-taking zone aligned with weekly expiry forces. Volume confirmation above H3 77,858.77 is essential to distinguish a genuine recovery from a dead-cat bounce. |
▼ Downside Path → OI-S **L3 77,597.55 → PDL 77,453.75 / S1 77,478.38 / L4 77,466.95 → L5 77,314.41 → L6 77,251.55 / S2 77,228.60 → S3 77,003.45 → OI-S 75,000** — below L3 77,597.55, retail stop-losses trigger a wave of selling that accelerates through the PDL/S1/L4 cluster (77,453–77,479), where Camarilla L4 at 77,466.95 represents the breakdown trigger signalling trend continuation to L5 77,314.41 and L6 77,251.55. S3 77,003.45 and the eventual OI-S 75,000 are extreme downside references relevant only for multi-day sustained sell-offs. |
| 🔴 OI-R: **OI Resistance at 79,000** — in a gap-down scenario, the CE max OI at 79,000 is over 1,271 points above current price and is entirely irrelevant as an intraday level; call writers at 79,000 are deeply out of the money and exert no near-term hedging pressure on the market. Its analytical value in this scenario is as context for the upside cap — any intraday recovery rally is bounded by the CPR band (77,691–77,715) and H3 77,858.77 as realistic targets, far below the OI-R ceiling. | 🟢 OI-S: **OI Support at 75,000** — the SENSEX monthly PE max OI strike is the ultimate structural floor, but its distance (approximately 2,728 points below current price) makes it an irrelevant intraday level in most gap-down scenarios. Its significance for intraday analysis is structural — the fact that put writers are positioned at 75,000 indicates massive premium collection at a strike far below, which means there is no meaningful put-writer buying support until price is within striking distance of 75,000 — a level that would imply a catastrophic 3.5%+ single-day decline. |
⚡ Key Trigger: **Failure to reclaim BC 77,691.21 within the first 15 minutes** is the primary bear confirmation for SENSEX in a gap-down scenario — it validates that the Descending CPR structure is functioning as overhead resistance and that the prior session's selling momentum is continuing into the new session, activating targets at L3 77,597.55 → PDL/S1/L4 cluster → L5 77,314.41. The bull counter-trigger requires a **15-minute close above TC 77,715.85** — this is the genuine recovery confirmation that activates the gap-fill trade toward H3 77,858.77, Max Pain 77,900, and R1 77,953.31.
◆ Near Flat Open — Open ≈ Prev Close (±0.05%)
◆ Neutral
Open lands: SENSEX closed at 77,728.16 with TC at 77,715.85 — a flat open within ±0.05% places price in approximately 77,689–77,767. This means a flat open lands with TC 77,715.85 and BC 77,691.21 clustered just below or at the opening price — the Descending CPR band is immediately at or just below where price opens, creating a hairline-trigger decision zone.
CPR role: Compression fulcrum and decision zone — the ultra-narrow 0.03% CPR (width just 24.64 points) creates one of the tightest possible decision zones in SENSEX; a flat open at ~77,728 puts price just 12 points above TC 77,715.85, meaning bulls need to hold this tiny buffer while bears need to push below BC 77,691.21 by only 37 points — the resolution of this micro-range in the first 15-minute candle will define the entire session's character.
Near Flat (±0.05%)
A flat open for SENSEX near 77,728.16 in the context of a Descending–Narrow CPR (0.03% width, 24.64 points) is perhaps the cleanest trend-day setup of all three indices today — the opening price of ~77,728 is only 12 points above TC 77,715.85, and the entire CPR band spans just 24.64 points, meaning the market will resolve direction almost instantly as the first candle forms. The Descending CPR structure means that structurally, price above TC 77,715.85 is a Descending Trend Reversal (bullish override) while price below BC 77,691.21 is full Descending CPR confirmation (bearish continuation), and the weekly Max Pain at 77,900 adds a 172-point gravitational pull upward that biases the flat-open scenario slightly toward the bull side. With the weekly straddle implying ±656 points of expected move and the current price sitting within the straddle's center zone, a flat open creates maximum directional ambiguity at the open but resolves into a trending day with very high probability given the 0.03% CPR width — historically, sub-0.05% CPR days produce directional trending moves in over 70% of sessions. The bull trigger is a 15-minute close above TC 77,715.85 targeting H3 77,858.77 → Max Pain 77,900 → R1 77,953.31 → OI-R 79,000, while the bear trigger is a 15-minute close below BC 77,691.21 targeting L3 77,597.55 → PDL 77,453.75 / S1 77,478.38 → L5 77,314.41 → OI-S 75,000.
|
▲ Upside Path → OI-R **TC 77,715.85 → H3 77,858.77 → PDH 77,928.68 / Max Pain 77,900 / R1 77,953.31 → H4 77,989.37 → H5 78,141.91 → H6 78,204.77 / R2 78,178.46 → OI-R 79,000** — the bull trend day from a flat open targets H3 77,858.77 (143 points from TC) as the first intraday milestone, where partial profits should be taken; H3 is the Camarilla mean-reversion zone and a natural stall point, but volume-backed continuation above H3 brings price into the Max Pain/R1/PDH cluster (77,900–77,953), which is the primary full-profit zone for the day given weekly expiry on 20 Aug 2026. Beyond H4 77,989.37, the Camarilla target zone of H5–H6 (78,141–78,204) requires exceptional momentum, and OI-R 79,000 is the structural ceiling for the entire bullish thesis. |
▼ Downside Path → OI-S **BC 77,691.21 → L3 77,597.55 → PDL 77,453.75 / S1 77,478.38 / L4 77,466.95 → L5 77,314.41 → L6 77,251.55 / S2 77,228.60 → S3 77,003.45 → OI-S 75,000** — a confirmed 15-minute close below BC 77,691.21 activates the Descending CPR's full bearish architecture; L3 77,597.55 is the first Camarilla mean-reversion support (94 points below BC) where initial covering may emerge, but the PDL/S1/L4 cluster (77,453–77,479) is the structural support zone where bears should take partial profits and reassess. L5 77,314.41 and L6 77,251.55 represent the Camarilla extreme downside zone, accessible only on a panic-driven bear trend day. |
| 🔴 OI-R: **OI Resistance at 79,000** — in a flat-open scenario for SENSEX, OI-R 79,000 is 1,271 points above the opening price and represents the absolute ceiling for the bull trend day, where CE writers at this weekly strike will aggressively sell futures. The practical implication for intraday traders is that longs should be fully exited well before 79,000 — specifically at R2 78,178.46 or H6 78,204.77 — and the 79,000 CE wall is so far away from current price that it creates no near-term gamma pressure, leaving the upside path relatively unobstructed until those levels are approached. | 🟢 OI-S: **OI Support at 75,000** — the SENSEX monthly PE max OI strike is 2,728 points below the flat opening price, making it a distant structural anchor rather than an actionable intraday level; its role in the flat-open scenario is to confirm that put writers are not concerned about downside risk at current price levels, which provides a psychological floor for bulls. The PE base at 75,000 means that bear-trend-day targets of L3 77,597.55 through S3 77,003.45 are all well above the structural OI floor — traders should not extrapolate intraday bearish momentum as a signal of systemic risk while 75,000 PE remains the max OI anchor. |
⚡ Key Trigger: **First 15-minute candle close above TC 77,715.85 = bull trend day signal** — this is a Descending Trend Reversal trigger where the downward-sloping CPR is overtaken by bulls, and the 0.03% width means there is essentially zero CPR friction above TC; targets are H3 77,858.77 immediately, then Max Pain 77,900 and R1 77,953.31 as the convergence zone. **First 15-minute candle close below BC 77,691.21 = bear trend day signal** confirming the Descending CPR is acting as overhead resistance with the entire band (77,691–77,715) as a ceiling; targets are L3 77,597.55 and the critical support cluster at PDL 77,453.75 / S1 77,478.38 / L4 77,466.95 — the structural significance is that in a Descending CPR, bears have the structural advantage and need less confirmation to activate their scenario.
📊 VIX Insight: India VIX data is unavailable for the 17 Aug 2026 session, which removes a critical premium-sizing tool from the analyst's toolkit — without VIX, the precise expected move validation from implied volatility cannot be confirmed. Traders should substitute the weekly straddle values (NIFTY ±115.65 pts, SENSEX ±656 pts) as proxy volatility gauges and exercise caution with oversized positions until VIX data resumes, as an unquantified volatility environment demands tighter stop-losses and reduced contract sizes.
Overall View:
All three indices — NIFTY, BANKNIFTY, and SENSEX — carry synchronized Descending–Narrow CPR structures for 18 Aug 2026, creating an unusually aligned market setup where the first 15-minute candle direction across all indices will almost certainly dictate the entire session's trend. The consistent Descending CPR positioning (CPR bands below previous closing prices for all three) implies that the market is in a structurally weak posture entering the session, but the proximity of Max Pain levels (NIFTY 24,350 vs close 24,287, SENSEX 77,900 vs close 77,728, BANKNIFTY 57,800 vs close 57,497) — all above current prices — creates an options-market gravitational pull upward that could trigger a counter-trend squeeze if bulls reclaim their respective TC levels in the opening 15 minutes. With India VIX data absent, position sizing should be conservative, and the preferred risk management approach is to trade only confirmed directional breakouts above TC or breakdowns below BC — avoid anticipatory positions inside the CPR compression bands for all three indices.
All three indices — NIFTY, BANKNIFTY, and SENSEX — carry synchronized Descending–Narrow CPR structures for 18 Aug 2026, creating an unusually aligned market setup where the first 15-minute candle direction across all indices will almost certainly dictate the entire session's trend. The consistent Descending CPR positioning (CPR bands below previous closing prices for all three) implies that the market is in a structurally weak posture entering the session, but the proximity of Max Pain levels (NIFTY 24,350 vs close 24,287, SENSEX 77,900 vs close 77,728, BANKNIFTY 57,800 vs close 57,497) — all above current prices — creates an options-market gravitational pull upward that could trigger a counter-trend squeeze if bulls reclaim their respective TC levels in the opening 15 minutes. With India VIX data absent, position sizing should be conservative, and the preferred risk management approach is to trade only confirmed directional breakouts above TC or breakdowns below BC — avoid anticipatory positions inside the CPR compression bands for all three indices.
Disclaimer: KRVFinMart provides educational and informational content relating to financial markets. Articles, research, examples, charts, strategies and tools are provided for educational purposes and should not be interpreted as personalised investment advice or a guarantee of financial performance. Markets involve risk, including possible loss of capital. Past performance does not guarantee future results. KRVFinMart is not a SEBI Registered Investment Adviser or Research Analyst.