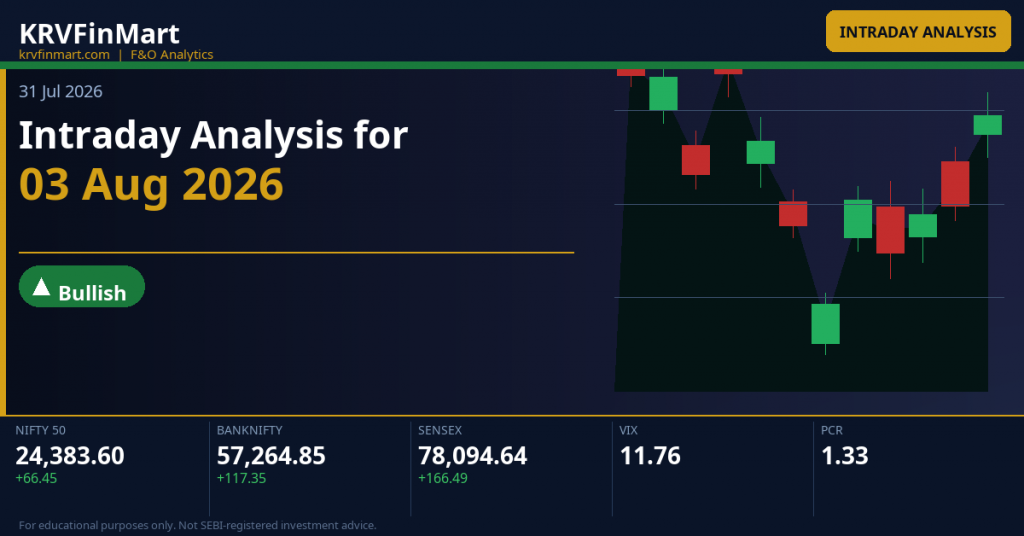
Intraday Analysis for 31 Jul 2026
Markets closed on a mixed note on 30 Jul 2026 with Nifty adding +0.28% to 24,317.15, Sensex gaining +0.35% to 77,928.15, while BankNifty slipped marginally by -0.10% to 57,147.50. India VIX data is unavailable for this session, making it difficult to gauge premium richness, but the moderate straddle values — Nifty weekly at 220.8 pts and BankNifty monthly at 1,647.3 pts — suggest the market is not pricing in an outsized move for 31 Jul. With the monthly expiry cycle still open and max pain anchors (Nifty 24,250 weekly / BankNifty 57,500 monthly) sitting close to current prices, option sellers remain in control and the gravitational pull toward max pain will be a key intraday theme.
All three indices are trading above their respective weekly and monthly CPR bands, signalling multi-timeframe bullish structure, but BankNifty’s descending day CPR and proximity to the OI-S wall at 57,000 highlight relative weakness that could drag the broader market if that level breaks. With India VIX unavailable, traders should use the Nifty weekly straddle of 220.8 pts as the implied daily range proxy — a move beyond 24,538 on the upside or 24,096 on the downside would be an above-expectation event.
NIFTY 50
|
NIFTY 50
24,317.15
▲ +66.95 (+0.28%)
|
INDIA VIX
12.15
▲ +1.23%
Low Fear Zone
|
PCR
|
OI PCR
Week: 1.29
Month: 1.14
|
Vol PCR
Week: 0.87
Month: 1.13
|
|
ATM STRADDLE
Week220.80 pts
Month588.00 pts
|
|
OI SUPPORT (PE)
Week24,000
Month24,000
|
OI RESIST (CE)
Week24,600
Month25,000
|
CPR RELATIONSHIP
DayAscending — Medium
WeekOverlapping — Wide
MonthOverlapping — Wide
|
MAX PAIN
Week24,250
Month24,200
|
Week expiry: 04-Aug-2026 · Month expiry: 25-Aug-2026
BANK NIFTY
|
BANK NIFTY
57,147.50
▼ -58.40 (-0.10%)
|
INDIA VIX
12.15
▲ +1.23%
Low Fear Zone
|
PCR
|
OI PCR
Week: —
Month: 0.88
|
Vol PCR
Week: —
Month: 0.89
|
|
ATM STRADDLE
Month1,647.30 pts
|
|
OI SUPPORT (PE)
Month57,000
|
OI RESIST (CE)
Month58,000
|
CPR RELATIONSHIP
DayDescending — Medium
MonthOverlapping — Wide
|
MAX PAIN
Month57,500
|
Month expiry: 25-Aug-2026
SENSEX
|
SENSEX
77,928.15
▲ +273.55 (+0.35%)
|
INDIA VIX
12.15
▲ +1.23%
Low Fear Zone
|
PCR
|
OI PCR
Week: 1.64
Month: 1.64
|
Vol PCR
Week: 0.99
Month: 0.99
|
|
ATM STRADDLE
Week24.55 pts
Month24.55 pts
|
|
OI SUPPORT (PE)
Week77,900
Month77,900
|
OI RESIST (CE)
Week78,000
Month78,000
|
CPR RELATIONSHIP
DayAscending — Medium
WeekOverlapping — Wide
MonthOverlapping — Wide
|
MAX PAIN
Week77,900
Month77,900
|
Week expiry: 30 Jul 2026 · Month expiry: 30 Jul 2026
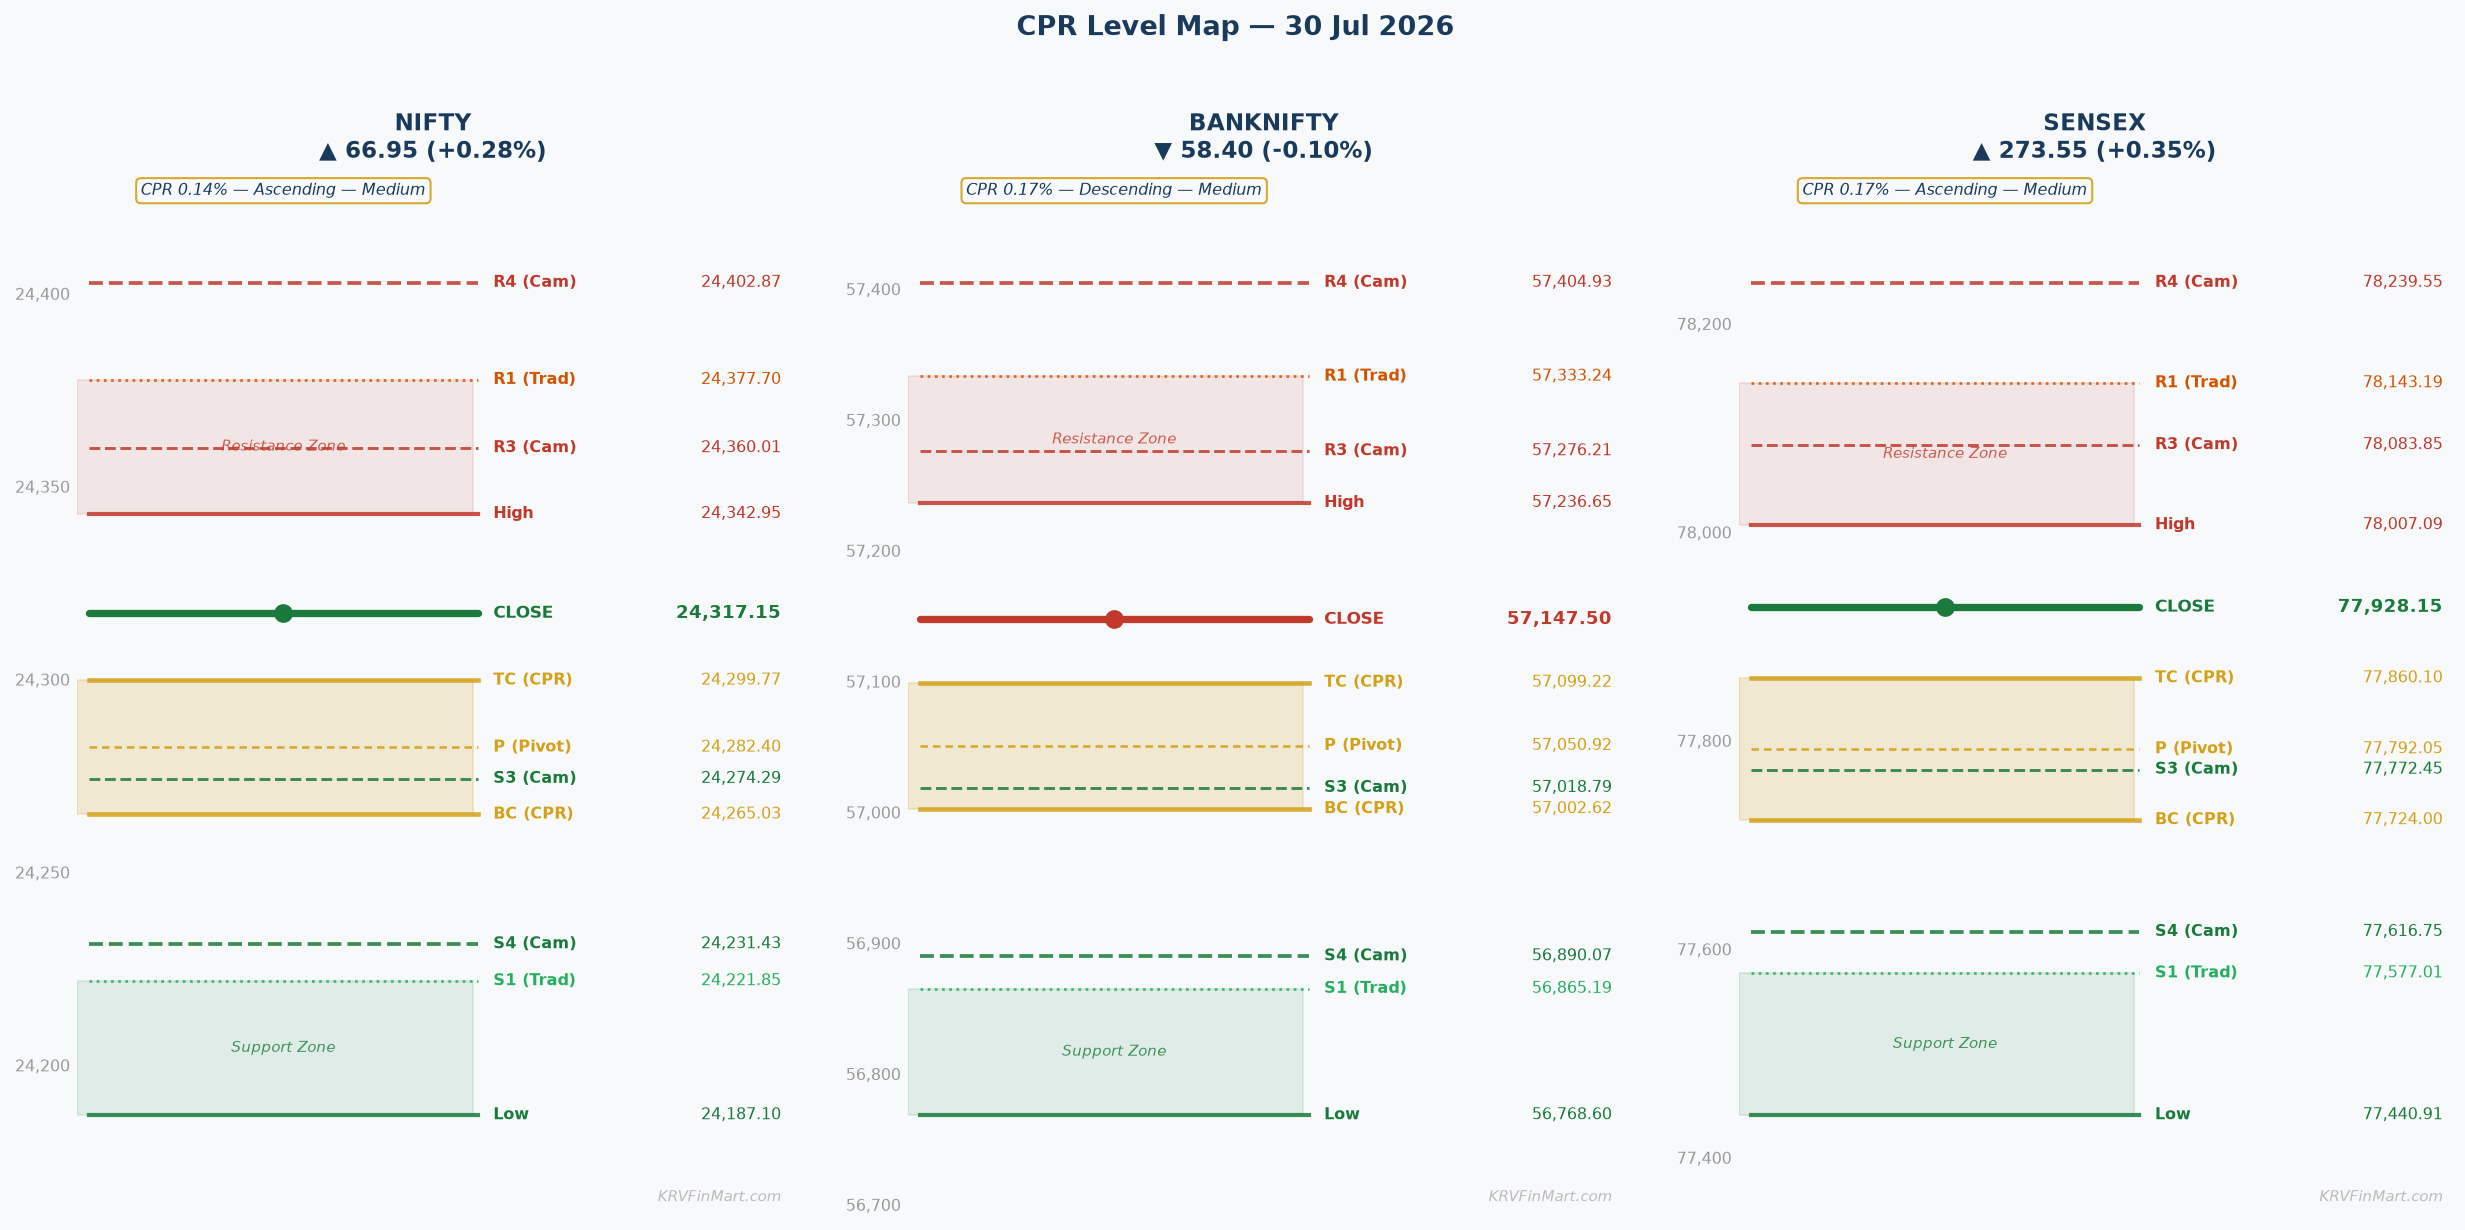
NIFTY
Ascending — Medium (Width 0.14%)
▲ Bullish
|
Market Structure
Balanced or transitional |
Straddle
ATM 24,300 weekly straddle = **220.8 pts** (Call 106.1 + Put 114.7), implying a one-standard-deviation intraday range of roughly **24,079 – 24,521**; monthly straddle at 588.0 pts confirms broader range context. |
Max Pain
Weekly max pain at **24,250** (expiry 04-Aug-2026) — just below current price of 24,317.15, suggesting mild gravitational pull downward toward 24,250 intraday; monthly max pain at 24,200 adds a secondary magnet. |
Tomorrow’s Complete Level Map
OI-R: 24,600 R3: 24,533.55 H6: 24,473.84 H5: 24,452.93 R2: 24,438.25 H4 ▶: 24,402.87 R1: 24,377.70 PDH: 24,342.95 H3 ↩: 24,360.01
TC: 24,299.77 P: 24,282.40 BC: 24,265.03
L3 ↩: 24,274.29 PDL: 24,187.10 S1: 24,221.85 L4 ▶: 24,231.43 S2: 24,126.55 L5: 24,181.37 L6: 24,160.46 S3: 24,066 OI-S: 24,000
↩ = Camarilla reversal point | ▶ = Camarilla breakout/breakdown trigger | OI-R/OI-S = Options wall (CE/PE max OI)
▲ Higher Open (Gap Up) — Open > Prev Close
▲ Bullish
Open lands: Ascending CPR with BC at 24,265.03 is above yesterday’s close (24,317.15 was the prev close but the CPR BC is below it — the Ascending structure means the entire new CPR band sits above the previous TC). A gap up open places price **inside or above the CPR band (24,265.03–24,299.77)** for a minor gap, or **above TC 24,299.77** for a significant/large gap, immediately positioning bulls in control territory.
CPR role: Launch pad — the CPR band (BC 24,265.03 to TC 24,299.77) acts as a base of support; as long as price holds above TC 24,299.77 on a 30-min close, the band confirms bullish trend continuation.
Minor Gap (0.05–0.25%) — Structure Dominant
Minor gap (0.05–0.25%): Open lands inside CPR around 24,317–24,355. Structure dominant — Ascending Medium CPR signals bullish lean. Watch for 30-min close above TC 24,299.77 to confirm. First target is Camarilla H3 (mean-reversion stall) at **24,360.01**, then PDH **24,342.95** as immediate hurdle. Momentum continuation targets PDH breakout → R1 **24,377.70** → H4 **24,402.87**.
Significant Gap (0.25–0.5%) — Balanced
Significant gap (0.25–0.5%): Open above TC 24,299.77, likely near 24,380–24,440. Gap and CPR structure equally balanced. Price opens above H3 **24,360.01** territory — watch for retest of H3 as support within first 30 mins. Confirmed hold of H3 targets R1 **24,377.70** → H4 **24,402.87** → R2 **24,438.25**. Failure of H3 retest pulls back toward TC **24,299.77**.
Large Gap (>0.5%) — Gap Direction Dominant
Large gap (>0.5%): Open above 24,438, potentially near H4–H5 zone (24,402.87–24,452.93). Gap dominates — CPR is now well below price as deep support. Fade risk is high near H5 **24,452.93** and H6 **24,473.84**. Look for 30-min consolidation; breakout above R2 **24,438.25** targets R3 **24,533.55** and then OI-R **24,600**. Aggressive gap fills pull back to H4 **24,402.87**.
|
▲ Upside Path → OI-R
H3 (Camarilla mean-reversion stall) **24,360.01** → PDH (prior session high resistance) **24,342.95** → R1 (first Traditional target, partial profit) **24,377.70** → H4 (Camarilla breakout trigger) **24,402.87** → R2 (second partial) **24,438.25** → H5 **24,452.93** → H6 **24,473.84** → R3 **24,533.55** → OI-R (CE max OI wall — primary ceiling) **24,600**. |
▼ Downside Path → OI-S
If gap up fails to hold: TC **24,299.77** → P **24,282.40** → BC **24,265.03** → L3 (Camarilla mean-reversion floor) **24,274.29** → S1 **24,221.85** → L4 (breakdown trigger) **24,231.43** → L5 **24,181.37** → PDL **24,187.10** → S2 **24,126.55** → OI-S **24,000**. |
|
🔴 OI-R: OI-R at **24,600** is the primary CE max OI wall — a hard ceiling where call writers defend aggressively; approach with caution and take full profits at or near this level rather than trailing beyond. |
🟢 OI-S: OI-S at **24,000** is the PE max OI floor — deep support; only relevant as an abort-and-re-evaluate level if the gap up scenario fails catastrophically and price cascades through all Camarilla supports. |
⚡ Key Trigger: 30-min close above TC **24,299.77** confirms bullish bias. For larger gaps, 30-min close above PDH **24,342.95** is the momentum trigger. Trail stop to P **24,282.40** after partial at R1.
▼ Lower Open (Gap Down) — Open < Prev Close
▼ Bearish
Open lands: Ascending CPR means the new CPR band (BC 24,265.03–TC 24,299.77) sits above yesterday’s close context. A gap down open places price **below BC 24,265.03**, meaning price opens below the entire ascending CPR band — this is bearish confirmation as the ascending structure’s support is immediately violated.
CPR role: Overhead resistance / trap door — the entire CPR band (BC 24,265.03 to TC 24,299.77) becomes a resistance ceiling to recover; price below BC signals bearish control for the session.
Minor Gap (0.05–0.25%) — Structure Dominant
Minor gap (0.05–0.25%): Open near 24,270–24,305, likely just below or just at BC **24,265.03**. Structure dominant — Ascending CPR turned overhead resistance. A 30-min close below BC **24,265.03** confirms bearish session. L3 **24,274.29** acts as first Camarilla reversion floor; breakdown targets S1 **24,221.85** and L4 **24,231.43**.
Significant Gap (0.25–0.5%) — Balanced
Significant gap (0.25–0.5%): Open near 24,195–24,255, well below BC **24,265.03**. Gap and structure balanced in bearish direction. Price is near L4 **24,231.43** and S1 **24,221.85** zone — these become the immediate support cluster. 30-min close below S1 **24,221.85** accelerates toward PDL **24,187.10** → L5 **24,181.37** → S2 **24,126.55**.
Large Gap (>0.5%) — Gap Direction Dominant
Large gap (>0.5%): Open below 24,195, near or below PDL **24,187.10**. Gap dominates. Price is at L5 **24,181.37**–L6 **24,160.46** zone — potential bounce from oversold Camarilla extreme. However, two 30-min closes below PDL confirm continuation toward S2 **24,126.55** → S3 **24,066** → OI-S **24,000**.
|
▲ Upside Path → OI-R
Recovery path (if bears fail): L3 **24,274.29** → BC **24,265.03** → P **24,282.40** → TC **24,299.77** → H3 **24,360.01** → R1 **24,377.70** → OI-R **24,600**. |
▼ Downside Path → OI-S
L3 **24,274.29** (first Camarilla floor stall) → S1 **24,221.85** → L4 **24,231.43** (breakdown trigger) → PDL **24,187.10** → L5 **24,181.37** → L6 **24,160.46** → S2 **24,126.55** → S3 **24,066** → OI-S (PE wall / floor) **24,000**. |
|
🔴 OI-R: OI-R at **24,600** is irrelevant in a gap-down bearish scenario unless a full reversal occurs; acts as a distant ceiling confirming the structural range. |
🟢 OI-S: OI-S at **24,000** is the PE max OI floor and primary downside target in a large gap-down scenario — put writers will defend this level aggressively, making it a high-probability bounce or exit zone for shorts. |
⚡ Key Trigger: 30-min close below BC **24,265.03** confirms bearish session. Recovery trigger: 30-min close above TC **24,299.77** negates the gap-down bearish thesis — flip to flat/bullish scenario.
◆ Near Flat Open — Open ≈ Prev Close (±0.05%)
◆ Neutral
Open lands: Ascending CPR means BC **24,265.03** is the lowest band level and sits above previous context. A flat open near 24,305–24,329 (±0.05% of 24,317.15) places price **just above TC 24,299.77** — at or slightly above the top of the CPR band. This is an Ascending CPR flat-open scenario where price is at the upper edge of the band.
CPR role: Decision zone / pivot — price sitting just above TC **24,299.77** means the CPR band is tight support below. Bulls hold as long as TC holds; a dip below BC **24,265.03** flips to bearish. CPR is the battleground for the session.
Near Flat (±0.05%)
With no gap signal (±0.05%), CPR structure is the ONLY bias driver. The Ascending Medium CPR gives a mild bullish lean — the band (BC 24,265.03–TC 24,299.77) acts as support below current price. Price near 24,317 is slightly above TC **24,299.77**, so the opening condition is marginally bullish. The 30-min close rule applies (Medium width 0.14%). A **30-min close above PDH 24,342.95** triggers momentum toward H3 **24,360.01** → R1 **24,377.70** → H4 **24,402.87**. A **30-min close below BC 24,265.03** confirms bearish control targeting L4 **24,231.43** → S1 **24,221.85** → PDL **24,187.10**. The max pain pull toward **24,250** (weekly) makes a drift toward BC zone in the first hour plausible before direction resolves. Scalpers watch P **24,282.40** as the intraday fulcrum — longs above, shorts below.
|
▲ Upside Path → OI-R
TC **24,299.77** (CPR band — held support) → PDH **24,342.95** (momentum trigger) → H3 **24,360.01** (Camarilla stall, first partial) → R1 **24,377.70** (Traditional first target) → H4 **24,402.87** (Camarilla breakout) → R2 **24,438.25** → OI-R **24,600** (CE max OI ceiling). |
▼ Downside Path → OI-S
BC **24,265.03** (CPR breakdown) → L3 **24,274.29** → P **24,282.40** (scalp pivot lost) → S1 **24,221.85** → L4 **24,231.43** → PDL **24,187.10** → L5 **24,181.37** → OI-S **24,000**. |
|
🔴 OI-R: OI-R at **24,600** is the CE max OI ceiling — target for a sustained trending day; in a flat-open balanced session it likely acts as a distant reference rather than an immediate target unless momentum builds strongly. |
🟢 OI-S: OI-S at **24,000** is the PE max OI floor — strong structural support; a bearish session that reaches this level would test the conviction of put writers and likely see significant bounce activity. |
⚡ Key Trigger: 30-min close above PDH **24,342.95** for bullish momentum entry; 30-min close below BC **24,265.03** for bearish confirmation. P **24,282.40** is the intraday scalp pivot.
BANKNIFTY
Descending — Medium (Width 0.17%)
▼ Bearish
|
Market Structure
Balanced or transitional |
Straddle
ATM 57,100 monthly straddle = **1,647.3 pts** (Call 912.5 + Put 734.8), implying a broad intraday range of roughly **55,453 – 58,747**; this wide monthly straddle reflects elevated premium and a wider expected move for BankNifty vs Nifty. |
Max Pain
Monthly max pain at **57,500** (expiry 25-Aug-2026) — above current price of 57,147.50, creating an upward gravitational pull of ~352 pts toward 57,500; this is a bullish force from max pain perspective despite the Descending CPR. |
Tomorrow’s Complete Level Map
OI-R: 58,000 H6: 57,618.67 H5: 57,555.27 R2: 57,518.97 H4 ▶: 57,404.93 R1: 57,333.24 PDH: 57,236.65 H3 ↩: 57,276.21
TC: 57,099.22 P: 57,050.92 BC: 57,002.62
L3 ↩: 57,018.79 PDL: 56,768.60 S1: 56,865.19 L4 ▶: 56,890.07 S2: 56,582.87 L5: 56,739.73 L6: 56,676.33 S3: 56,397.14 OI-S: 57,000
↩ = Camarilla reversal point | ▶ = Camarilla breakout/breakdown trigger | OI-R/OI-S = Options wall (CE/PE max OI)
▲ Higher Open (Gap Up) — Open > Prev Close
▲ Bullish
Open lands: Descending CPR means TC **57,099.22** is the top of the band and the entire CPR sits below yesterday’s close of 57,147.50. A gap up open places price **above TC 57,099.22** — above the entire descending CPR band — which is a hidden strength signal (Descending Trend Reversal: prev close already above TC).
CPR role: Overhead pressure turned support — the descending CPR band (BC 57,002.62–TC 57,099.22) sits below price on a gap up; if price holds above TC **57,099.22**, the band transitions to a support base; if price falls back inside, sellers reassert.
Minor Gap (0.05–0.25%) — Structure Dominant
Minor gap (0.05–0.25%): Open near 57,205–57,290, above TC **57,099.22** but near PDH **57,236.65**. Structure has precedence — Descending CPR with price above TC is a hidden strength signal. 30-min close above TC **57,099.22** confirms. Immediate hurdle at PDH **57,236.65**; breakout above PDH targets H3 **57,276.21** → R1 **57,333.24**.
Significant Gap (0.25–0.5%) — Balanced
Significant gap (0.25–0.5%): Open near 57,290–57,433, potentially above H3 **57,276.21**. Gap and structure balanced — significant bullish signal. 30-min close above PDH **57,236.65** confirms momentum toward R1 **57,333.24** → H4 **57,404.93** → R2 **57,518.97**. Max pain at **57,500** aligns with R2 as a natural target.
Large Gap (>0.5%) — Gap Direction Dominant
Large gap (>0.5%): Open above 57,433, near H4 **57,404.93**–H5 **57,555.27** zone. Gap dominates. Price near max pain **57,500** on open — watch for consolidation and potential fade. Two 30-min closes needed; R2 **57,518.97** and H5 **57,555.27** are key zones. Beyond H5/H6 **57,618.67** targets R3 **57,801.29** → OI-R **58,000**.
|
▲ Upside Path → OI-R
TC **57,099.22** (CPR base support) → PDH **57,236.65** (momentum trigger) → H3 **57,276.21** (Camarilla stall) → R1 **57,333.24** (first Traditional partial) → H4 **57,404.93** (Camarilla breakout trigger) → R2 **57,518.97** (max pain zone — second partial) → H5 **57,555.27** → H6 **57,618.67** → R3 **57,801.29** → OI-R **58,000** (CE wall — primary ceiling). |
▼ Downside Path → OI-S
If gap up fails: TC **57,099.22** → P **57,050.92** → BC **57,002.62** → L3 **57,018.79** → OI-S **57,000** (critical PE wall) → S1 **56,865.19** → L4 **56,890.07** → PDL **56,768.60** → L5 **56,739.73**. |
|
🔴 OI-R: OI-R at **58,000** is the primary CE max OI ceiling — a strong supply wall where call writers defend; take full profits on approach rather than chasing beyond. |
🟢 OI-S: OI-S at **57,000** is the PE max OI floor — extremely close to BC **57,002.62**, creating a powerful double support cluster; in a gap-up scenario it is a deep abort level that should not be tested. |
⚡ Key Trigger: 30-min close above PDH **57,236.65** is the momentum trigger. Partial profit at R1 **57,333.24**; trail stop to TC **57,099.22** after second partial at H4 **57,404.93**.
▼ Lower Open (Gap Down) — Open < Prev Close
▼ Bearish
Open lands: Descending CPR with TC at **57,099.22** means a gap down open places price **inside the CPR band (BC 57,002.62–TC 57,099.22) or below BC 57,002.62** — inside the descending CPR is the classic Descending bearish scenario.
CPR role: Resistance zone / trap door — inside or below the descending CPR band, the band acts as overhead resistance; BC **57,002.62** and the critical OI-S **57,000** form a crucial double support cluster just below.
Minor Gap (0.05–0.25%) — Structure Dominant
Minor gap (0.05–0.25%): Open near 57,000–57,090, inside CPR or just at BC **57,002.62**. Structure dominant — inside Descending CPR with OI-S **57,000** right at BC. This is the most critical battleground. 30-min close below BC **57,002.62** AND below OI-S **57,000** is a high-conviction bearish signal targeting L4 **56,890.07** → S1 **56,865.19** → PDL **56,768.60**.
Significant Gap (0.25–0.5%) — Balanced
Significant gap (0.25–0.5%): Open near 56,804–56,947, below BC **57,002.62** and below OI-S **57,000**. Gap and structure both bearish. Price near L4 **56,890.07**–S1 **56,865.19** cluster — immediate support. 30-min close below S1 **56,865.19** accelerates toward PDL **56,768.60** → L5 **56,739.73** → L6 **56,676.33** → S2 **56,582.87**.
Large Gap (>0.5%) — Gap Direction Dominant
Large gap (>0.5%): Open below 56,804, near or below PDL **56,768.60**. Gap dominates. Price at L5 **56,739.73**–L6 **56,676.33** extreme Camarilla zone — potential bounce from oversold. Two 30-min closes below PDL confirm continuation toward S2 **56,582.87** → S3 **56,397.14**. OI-S **57,000** is now a distant recovery hurdle.
|
▲ Upside Path → OI-R
Recovery: OI-S **57,000** (PE wall bounce) → BC **57,002.62** → L3 **57,018.79** → P **57,050.92** → TC **57,099.22** → PDH **57,236.65** → H3 **57,276.21** → OI-R **58,000**. |
▼ Downside Path → OI-S
BC **57,002.62** → OI-S **57,000** (PE wall — if broken, high acceleration) → L4 **56,890.07** → S1 **56,865.19** → PDL **56,768.60** → L5 **56,739.73** → L6 **56,676.33** → S2 **56,582.87** → S3 **56,397.14**. |
|
🔴 OI-R: OI-R at **58,000** is the distant CE ceiling — irrelevant in a gap-down scenario unless a full reversal occurs; marks the extreme upside boundary. |
🟢 OI-S: OI-S at **57,000** is the PE max OI floor and the most critical level in this scenario — it overlaps with BC **57,002.62** creating a double support cluster; a clean break below **57,000** triggers aggressive selling toward S1–S2 zone. |
⚡ Key Trigger: 30-min close below BC **57,002.62** and OI-S **57,000** together — this double breakdown is the primary bearish trigger. Recovery: 30-min close back above TC **57,099.22** negates bearish thesis.
◆ Near Flat Open — Open ≈ Prev Close (±0.05%)
◆ Neutral
Open lands: Descending CPR means TC **57,099.22** sits below yesterday’s close of 57,147.50. A flat open near 57,119–57,176 (±0.05% of 57,147.50) places price **above TC 57,099.22** — above the entire descending CPR band. This is the Descending Trend Reversal scenario: two sessions with prev close and open both above TC.
CPR role: Hidden strength base — price sitting above TC **57,099.22** with a Descending CPR is structurally counterintuitive; the band below acts as support rather than resistance, confirming hidden bullish strength. But max pain at **57,500** pulls upward.
Near Flat (±0.05%)
With no gap (±0.05%), CPR structure is the only signal. The Descending Medium CPR with price above TC **57,099.22** represents a Descending Trend Reversal — a hidden strength pattern. The CPR band (BC 57,002.62–TC 57,099.22) acts as support below price. However, BankNifty’s proximity to the critical OI-S at **57,000** (just 147.50 pts below close) creates a high-stakes battleground. A 30-min close above PDH **57,236.65** triggers bullish momentum toward R1 **57,333.24** and max pain **57,500** / R2 **57,518.97**. A 30-min close below TC **57,099.22** (entering the CPR band) is a warning sign; a further close below BC **57,002.62** and OI-S **57,000** triggers bearish cascade. The P **57,050.92** inside the band is the intraday pivot for scalpers. The Descending CPR in a flat-open scenario gives a mild bearish structural lean despite price being above TC — traders should wait for the 30-min confirmation before committing directionally.
|
▲ Upside Path → OI-R
TC **57,099.22** (CPR top — held support) → PDH **57,236.65** (momentum trigger) → H3 **57,276.21** (Camarilla stall, first partial) → R1 **57,333.24** → H4 **57,404.93** → R2 **57,518.97** (max pain alignment — full profit zone) → OI-R **58,000** (CE ceiling). |
▼ Downside Path → OI-S
TC **57,099.22** → P **57,050.92** → BC **57,002.62** → OI-S **57,000** (critical double breakdown) → L4 **56,890.07** → S1 **56,865.19** → PDL **56,768.60** → L5 **56,739.73** → S2 **56,582.87**. |
|
🔴 OI-R: OI-R at **58,000** is the CE max OI ceiling — primary upside target in a breakout scenario; the distance of ~852 pts from current price suggests it will only be reached on a strong trending day. |
🟢 OI-S: OI-S at **57,000** is the most critical intraday level for BankNifty — the PE max OI floor overlaps almost exactly with BC **57,002.62**, making any close below this level a high-conviction bearish signal and a potential accelerated move toward S1–S2. |
⚡ Key Trigger: 30-min close above PDH **57,236.65** for bullish momentum; 30-min close below TC **57,099.22** as warning; 30-min close below BC **57,002.62** and OI-S **57,000** for full bearish confirmation.
SENSEX
Ascending — Medium (Width 0.17%)
▲ Bullish
|
Market Structure
Balanced or transitional |
Straddle
ATM 77,900 weekly & monthly straddle = **24.55 pts** (Call 24.35 + Put 0.20) — this abnormally low straddle value with Put at just 0.20 suggests the weekly expiry (30 Jul 2026) has already expired or is deep in the money for calls; the Put at 0.20 implies negligible downside premium. Treat Sensex intraday analysis via CPR and Camarilla levels rather than straddle-implied move for 31 Jul. |
Max Pain
Weekly and monthly max pain both at **77,900** (expiry 30 Jul 2026 — this appears to be the expiry day data) — with Sensex closing at 77,928.15 on 30 Jul, max pain at **77,900** was effectively achieved; for 31 Jul, the next relevant options cycle will determine new max pain dynamics. |
Tomorrow’s Complete Level Map
OI-R: 78,000 R3: 78,709.37 H6: 78,497.89 H5: 78,421.41 R2: 78,358.23 H4 ▶: 78,239.55 R1: 78,143.19 PDH: 78,007.09 H3 ↩: 78,083.85
TC: 77,860.10 P: 77,792.05 BC: 77,724
L3 ↩: 77,772.45 PDL: 77,440.91 S1: 77,577.01 L4 ▶: 77,616.75 S2: 77,225.87 L5: 77,434.89 L6: 77,358.41 S3: 77,010.83 OI-S: 77,900
↩ = Camarilla reversal point | ▶ = Camarilla breakout/breakdown trigger | OI-R/OI-S = Options wall (CE/PE max OI)
▲ Higher Open (Gap Up) — Open > Prev Close
▲ Bullish
Open lands: Ascending CPR with BC **77,724** situated well below yesterday’s close of 77,928.15. A gap up open above 77,928.15 places price **inside the CPR band (BC 77,724–TC 77,860.10) — NO**, actually price at 77,928.15 is already above TC **77,860.10**. A gap up from 77,928.15 places price **above TC 77,860.10 and approaching OI-R 78,000 and PDH 78,007.09** — the CPR band is well below as support.
CPR role: Deep support base — the entire CPR band (BC 77,724–TC 77,860.10) sits ~68–204 pts below open; acts as a distant support floor; the immediate battleground is OI-R **78,000** and PDH **78,007.09**.
Minor Gap (0.05–0.25%) — Structure Dominant
Minor gap (0.05–0.25%): Open near 77,967–78,122, approaching OI-R **78,000** and PDH **78,007.09**. Structure dominant — Ascending Medium CPR confirms bullish lean. The critical test is OI-S **77,900** and OI-R **78,000** — these two OI levels are only 100 pts apart and form an extremely tight OI squeeze. A 30-min close above PDH **78,007.09** and OI-R **78,000** is the momentum trigger targeting H3 **78,083.85** → R1 **78,143.19**.
Significant Gap (0.25–0.5%) — Balanced
Significant gap (0.25–0.5%): Open near 78,122–78,317, above PDH **78,007.09** and OI-R **78,000**. Gap and structure balanced bullishly. Price near H3 **78,083.85** — this Camarilla level acts as first stall. 30-min close above H3 targets R1 **78,143.19** → H4 **78,239.55** → R2 **78,358.23**.
Large Gap (>0.5%) — Gap Direction Dominant
Large gap (>0.5%): Open above 78,317, near H4 **78,239.55**–H5 **78,421.41**. Gap dominates. Two 30-min closes needed for confirmation. H5 **78,421.41** and H6 **78,497.89** are extreme Camarilla upside targets; R3 **78,709.37** is next. Fade risk is elevated at H5–H6 zone.
|
▲ Upside Path → OI-R
OI-S **77,900** (now support) → TC **77,860.10** (CPR top — support) → PDH **78,007.09** (prior high breakout) → OI-R **78,000** (CE wall breakout — key trigger) → H3 **78,083.85** (Camarilla stall — first partial) → R1 **78,143.19** → H4 **78,239.55** (Camarilla breakout trigger) → R2 **78,358.23** → H5 **78,421.41** → H6 **78,497.89** → R3 **78,709.37**. |
▼ Downside Path → OI-S
If gap fails at OI-R **78,000**: OI-S **77,900** → TC **77,860.10** → P **77,792.05** → L3 **77,772.45** → BC **77,724** → S1 **77,577.01** → L4 **77,616.75** → PDL **77,440.91** → L5 **77,434.89** → S2 **77,225.87**. |
|
🔴 OI-R: OI-R at **78,000** is the primary CE max OI wall — in a gap-up scenario this is the first test; a confirmed breakout above **78,000** on a 30-min close is the key momentum catalyst for the session. |
🟢 OI-S: OI-S at **77,900** transitions from resistance to support in a gap-up scenario — if price opens above **77,900**, this level becomes the immediate floor; losing **77,900** on a 30-min close would be a bearish reversal signal. |
⚡ Key Trigger: 30-min close above PDH **78,007.09** and OI-R **78,000** simultaneously — this is the primary bullish trigger for 31 Jul Sensex. Partial profit at H3 **78,083.85** and R1 **78,143.19**; trail stop to TC **77,860.10**.
▼ Lower Open (Gap Down) — Open < Prev Close
▼ Bearish
Open lands: Ascending CPR with current price (77,928.15) already above TC **77,860.10**. A gap down places price back toward or into the CPR band (BC 77,724–TC 77,860.10). Critical: OI-S **77,900** sits between the close and TC, making it the first support test on any gap down.
CPR role: Support cluster with OI-S — TC **77,860.10** and OI-S **77,900** form a powerful support sandwich; price falling into the CPR band (below TC **77,860.10**) signals potential bearish pressure; below BC **77,724** = full bearish control.
Minor Gap (0.05–0.25%) — Structure Dominant
Minor gap (0.05–0.25%): Open near 77,789–77,889, between TC **77,860.10** and OI-S **77,900**. Structure dominant — falling into the CPR band on an Ascending CPR is bearish. Critical test: 30-min close below TC **77,860.10** confirms downside; hold above TC keeps bulls in play. L3 **77,772.45** and BC **77,724** are next supports.
Significant Gap (0.25–0.5%) — Balanced
Significant gap (0.25–0.5%): Open near 77,538–77,734, inside CPR band (BC 77,724–TC 77,860.10) or just below. Gap and structure both bearish. 30-min close below BC **77,724** confirms full bearish control targeting S1 **77,577.01** → L4 **77,616.75** → PDL **77,440.91**.
Large Gap (>0.5%) — Gap Direction Dominant
Large gap (>0.5%): Open below 77,538, below BC **77,724** and approaching L4 **77,616.75**–S1 **77,577.01** zone. Gap dominates. Two 30-min closes below BC confirm continuation toward PDL **77,440.91** → L5 **77,434.89** → S2 **77,225.87** → S3 **77,010.83**.
|
▲ Upside Path → OI-R
Recovery path: TC **77,860.10** → OI-S **77,900** → PDH **78,007.09** → OI-R **78,000** → H3 **78,083.85** → R1 **78,143.19** → H4 **78,239.55**. |
▼ Downside Path → OI-S
OI-S **77,900** → TC **77,860.10** → L3 **77,772.45** → P **77,792.05** → BC **77,724** → S1 **77,577.01** → L4 **77,616.75** → PDL **77,440.91** → L5 **77,434.89** → L6 **77,358.41** → S2 **77,225.87** → S3 **77,010.83**. |
|
🔴 OI-R: OI-R at **78,000** is the distant CE ceiling — in a gap-down scenario it marks the level bulls need to reclaim for trend restoration; it’s an abort reference for short positions. |
🟢 OI-S: OI-S at **77,900** is the PE max OI floor and the first critical support in any gap-down scenario — a close below **77,900** with the Ascending CPR band below signals acceleration; put writers will defend this level strongly making it a high-probability intraday bounce reference. |
⚡ Key Trigger: 30-min close below TC **77,860.10** as warning; 30-min close below BC **77,724** as full bearish confirmation. Recovery: 30-min close above OI-S **77,900** and TC **77,860.10** together negates bearish thesis.
◆ Near Flat Open — Open ≈ Prev Close (±0.05%)
◆ Neutral
Open lands: Ascending CPR with BC **77,724** and TC **77,860.10** well below yesterday’s close of 77,928.15. A flat open (±0.05%) near 77,889–77,967 places price **above TC 77,860.10** and just below or at OI-S **77,900** / OI-R **78,000** — the CPR band is entirely below as support, and the OI levels immediately above and below form the battleground.
CPR role: Distant support base — CPR band (BC 77,724–TC 77,860.10) is 68–204 pts below open; the immediate structural forces are OI-S **77,900** (just below) and OI-R **78,000** (just above) creating a 100-pt OI squeeze around the open price.
Near Flat (±0.05%)
With no gap signal (±0.05%), CPR structure is the only bias driver. The Ascending Medium CPR gives a mild bullish lean with the entire band as support below. However, the unique Sensex situation places the open directly in the OI squeeze between OI-S **77,900** and OI-R **78,000** — a range of just 100 pts. This is an extremely tight OI battleground. A 30-min close above OI-R **78,000** and PDH **78,007.09** is the bullish trigger targeting H3 **78,083.85** → R1 **78,143.19** (Medium CPR rule: partial at first Traditional target). A 30-min close below OI-S **77,900** is the bearish trigger targeting TC **77,860.10** → L3 **77,772.45** → BC **77,724**. The P **77,792.05** inside the CPR band acts as the deeper pivot for extended moves. Given the monthly expiry context and max pain at **77,900**, the session may be anchored near the 77,900–78,000 zone for much of the day — scalpers can trade the range with tight stops; directional traders wait for the OI squeeze breakout.
|
▲ Upside Path → OI-R
OI-S **77,900** (support held) → OI-R **78,000** (breakout trigger) → PDH **78,007.09** → H3 **78,083.85** (Camarilla stall — first partial profit) → R1 **78,143.19** (Traditional first target — second partial) → H4 **78,239.55** → R2 **78,358.23** → H5 **78,421.41** → R3 **78,709.37**. |
▼ Downside Path → OI-S
OI-S **77,900** (broken) → TC **77,860.10** → L3 **77,772.45** → P **77,792.05** → BC **77,724** → S1 **77,577.01** → L4 **77,616.75** → PDL **77,440.91** → L5 **77,434.89** → S2 **77,225.87** → S3 **77,010.83**. |
|
🔴 OI-R: OI-R at **78,000** is the CE max OI ceiling and the primary upside trigger — a 30-min close above **78,000** transforms it from a resistance wall into a confirmed breakout launch with H3 **78,083.85** and R1 **78,143.19** as immediate targets. |
🟢 OI-S: OI-S at **77,900** is the PE max OI floor and the critical downside trigger — coincides with max pain level; in a flat-open scenario it is the line between bullish and bearish for the session. Break below confirms bearish thesis; hold confirms support and potential upside continuation. |
⚡ Key Trigger: 30-min close above OI-R **78,000** and PDH **78,007.09** for bullish momentum; 30-min close below OI-S **77,900** for bearish confirmation. The 100-pt OI squeeze (77,900–78,000) is the defining intraday battleground for Sensex on 31 Jul.
📊 VIX Insight: India VIX data is unavailable for this session (marked as — with —% change), which limits our ability to assess premium richness and fear gauge direction. In the absence of VIX data, traders should use the Nifty weekly straddle of **220.8 pts** as the implied daily range proxy — upper bound ~24,538, lower bound ~24,096. BankNifty’s monthly straddle of **1,647.3 pts** reflects elevated absolute premium. The absence of a VIX spike signal suggests no major fear event is being priced; however, the end-of-month and proximity to multiple expiries warrants caution on position sizing. Monitor the first 30 minutes closely for directional cues in lieu of VIX guidance.
Overall View:
On 31 Jul 2026, Nifty’s Ascending Medium CPR with price already above TC **24,299.77** sets a mildly bullish tone, with the immediate test being whether bulls can clear PDH **24,342.95** and target the OI-R wall at **24,600**; the weekly max pain pull toward **24,250** may create an early dip that presents a buying opportunity. BankNifty faces a more complex setup — the Descending Medium CPR signals structural weakness, but the monthly max pain at **57,500** (+352 pts above close) creates an upward gravitational force; the decisive level is the OI-S/BC double-cluster at **57,000–57,002.62** — a break below triggers aggressive selling while a hold supports a recovery toward max pain. Sensex is the most confined of the three, caught in a 100-pt OI squeeze between OI-S **77,900** and OI-R **78,000** on an Ascending Medium CPR, making the breakout direction from this tight band the single most important intraday signal — watch the first 30-minute close to determine session direction across all three indices.
This analysis is for educational purposes only and is not investment advice.


Responses